What if your advanced AI system is either performing perfectly or silently failing? As Large Language Models (LLMs) become vital to business operations, the gap between smooth performance and costly disruptions narrows. These powerful models can transform how organizations engage with customers and analyze data. However, they also introduce significant challenges.
Without proper monitoring, LLMs may produce inaccurate or biased outputs. This can lead to negative consequences for businesses. Performance fluctuations can occur unexpectedly, impacting user experience and operational efficiency. Additionally, as reliance on LLMs increases, understanding their performance metrics and resource consumption is essential to avoid spiraling costs.
To ensure optimal performance, organizations must implement robust observability practices. So, in this blog, I’ve outlined how adopting proper observability practices can help teams successfully deploy and maintain LLM applications in production environments.
Let’s get started with a clarifying knowledge byte!
What is the difference between LLM Observability and LLM Monitoring?
While often used interchangeably, LLM observability and monitoring serve distinct but complementary purposes. That is, LLM monitoring consists of tracking application performance through evaluation metrics and methods, focusing on the ‘what’ of system behavior. LLM observability, on the other hand, is the broader process that makes monitoring possible by providing full visibility and tracing in an LLM application system. It helps you understand the ‘why’ behind system behaviors.
Here’s a table that shows their differences clearly:
| Aspect | LLM Monitoring | LLM Observability |
|---|---|---|
| Purpose | Tracks system performance and health metrics. | Provides full visibility into system behavior and helps diagnose the “why” behind issues. |
| Focus | Answers the question “What is happening?” | Answers the question “Why is this happening?” |
| Data Types | Primarily quantitative metrics, such as response times, error rates, and resource consumption. | Metrics, traces, and logs, offering a more holistic view of the system. |
| Main Role | Helps detect and alert teams about system anomalies. | Helps in troubleshooting, root cause analysis, and understanding system performance over time. |
Info break: Observability encompasses the collection and analysis of three of these key types of telemetry data:
- Metrics: Quantitative data points reflecting model health, such as response times, error rates, and resource consumption.
- Traces: Detailed journey of each request through the system, providing insights into processing steps.
- Logs: Historical records of specific events or anomalies during model execution.

Learn how to redefine your product strategy and innovate with GenAI at the forefront.
Now that you understand the differences, let’s explore why LLM observability is crucial for LLM systems and applications.
Why is LLM observability crucial for LLM systems?
Several factors make observability particularly important for LLM applications. Some of them are:
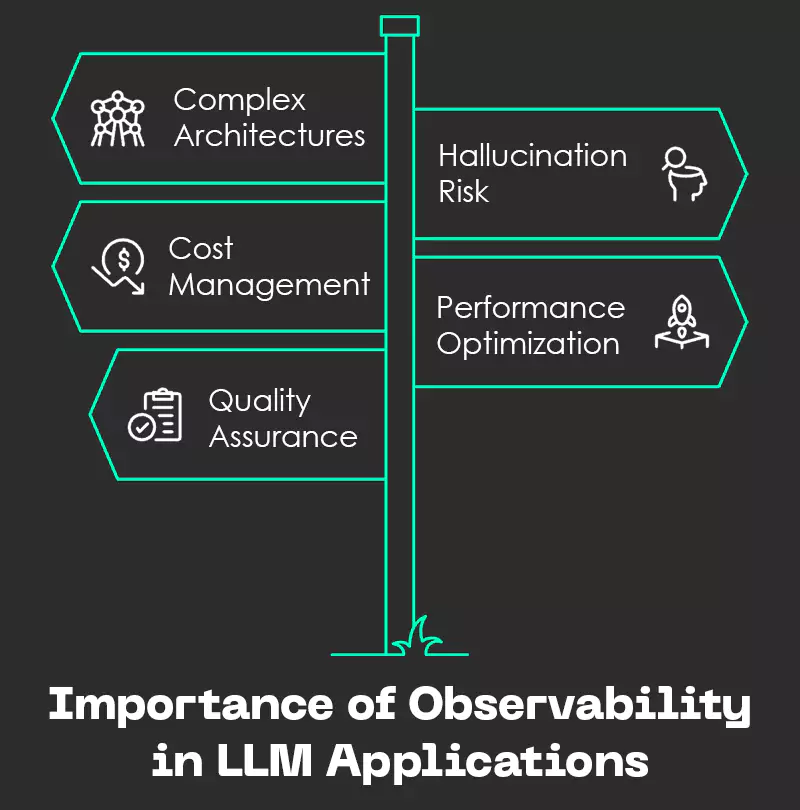
Fig: Importance of Observability in LLM Applications
- Complex Architectures: Modern LLM applications involve multiple components working together, such as retrieval systems, prompt management, model calls, and post-processing. Monitoring each of these components and understanding their interactions is essential for maintaining overall system health.
- Hallucination Risk: LLMs can generate plausible sounding but incorrect information. Without proper observability, these LLM hallucinations can go undetected and impact user experience. Here, LLM observability helps identify patterns in hallucinations and their root causes.
- Cost Management: LLM API calls can be expensive, especially at scale. Observability provides detailed insights into token usage, API calls, and associated costs, enabling better resource allocation and optimization.
- Performance Optimization: Response times and resource usage need continuous monitoring to ensure optimal performance. LLM observability helps identify bottlenecks and optimization opportunities across the entire system.
- Quality Assurance: Maintaining consistent output quality requires monitoring various metrics and user feedback. Observability provides the tools to track and analyze these quality indicators systematically.
Onwards to know about the core components of LLM observability!
What are the Key Components of LLM Observability?
Here are the five key components of LLM observability:
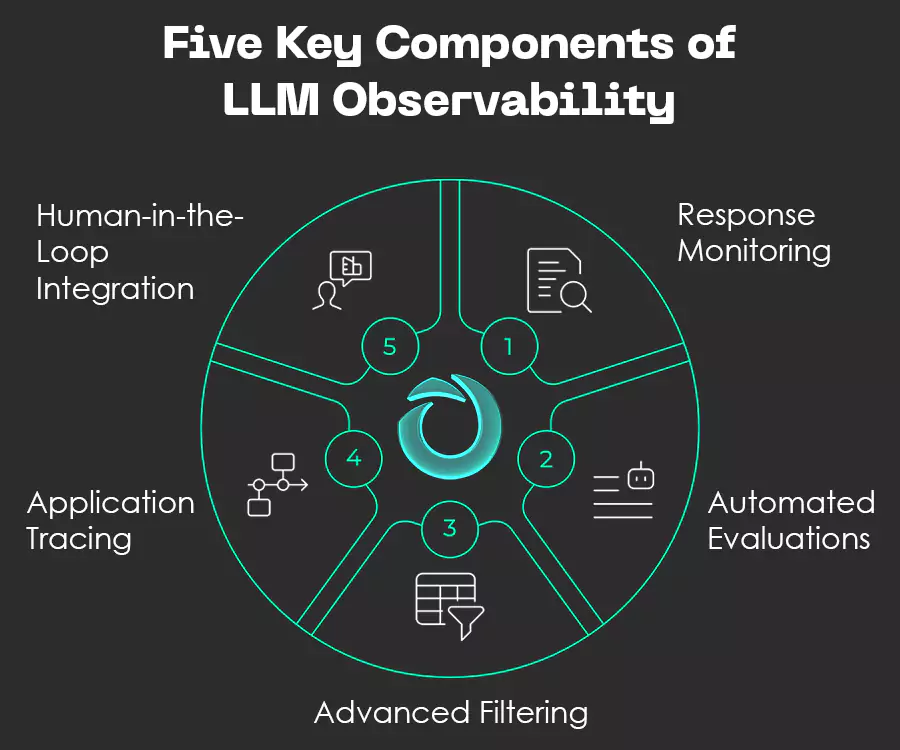
Fig: Five key components of LLM Observability
1. Response Monitoring
- Tracks user queries and LLM responses in real-time
- Monitors key metrics like completion time, token usage, and costs
- Records user IDs and conversation threads for traceability
- Tracks hyperparameters (model versions, prompt templates, temperature)
- Captures custom data points specific to business needs
2. Automated Evaluations
- Assesses model responses in real-time
- Tracks performance metrics without human intervention
- Automates quality checks for responses
- Detects potential hallucinations or incorrect information
- Integrates with existing evaluation frameworks
3. Advanced Filtering
- Filters capabilities for failing or undesirable responses
- Filters by user ID and conversation thread
- Applies hyperparameter-based filtering for A/B testing
- Implements custom data filtering for specific use cases
- Filters human feedback for quality control
4. Application Tracing
- Provides end-to-end visibility of request processing
- Monitors performance at component-level
- Identifies bottlenecks in the system
- Analyzes integration points
- Maps system interaction
5. Human-in-the-Loop Integration
- Collects user feedback through mechanisms
- Implements expert review processes for flagged outputs
- Integrates feedback into evaluation systems
- Establishes quality assurance workflows
- Supports continuous improvement cycles
If you’re looking to implement LLM observability, I’d recommend Langfuse – a powerful platform designed to provide deep insights into your LLM applications.
Learn everything about it next!
What is Langfuse and how is its architecture structured?
Langfuse offers a seamless and efficient way to implement LLM observability, making it easy to gain deep insights into your application’s performance. Designed for flexibility, it integrates effortlessly with existing workflows. This way, it enables real-time tracking of model responses, cost metrics, and user interactions.
One of its standout features is its decorator-based implementation, which allows developers to add observability with minimal modifications to their codebase. With built-in logging, tracing, and automated evaluations, Langfuse ensures that teams can monitor, debug, and optimize their LLM applications with ease.
Here are the key benefits of Langfuse:
- Comprehensive Monitoring: Provides end-to-end visibility into LLM operations, ensuring seamless tracking of system performance.
- Problem Detection: Acts as an early warning system, identifying potential issues before they impact functionality.
- Performance Optimization: Offers actionable insights to enhance system efficiency and responsiveness.
- Cost Management: Enables detailed tracking of resource usage, helping teams optimize expenditures.
- Quality Assurance: Continuously monitors output quality, ensuring reliable and accurate model performance.
Here’s an overview of Langfuse’s architecture, with a detailed breakdown provided below the diagram:

Fig: Architecture of Langfuse
1. Application Layer:
- Entry Point: Handles incoming user requests and application logic.
- Integration: Connects with LLM services (like GPT-4, Claude, etc.) seamlessly.
- Request Flow: Manages the flow of data between user inputs and LLM responses.
2. Langfuse Observability Layer:
a. Tracing System:
- Trace Creation: Initiates a new trace with each user interaction.
- Observation Types:
1. Spans: Represents time-bound operations like API calls and processing steps.
2. Events: Captures point-in-time occurrences within the system.
3. Generations: Tracks specific LLM output.
- Context Preservation: Maintains relationship between different operations.
b. Data Collection:
- Metrics Collection: Gathers quantitative data points like:
1. Response times
2. Token usage
3. Success/failure rates
- Event Logging: Records system events and state changes.
- Performance Tracking: Monitors system health and efficiency.
c. Analysis Layer:
- Automated Evaluation: Assesses responses in real time.
- Cost Analysis: Tracks and monitors costs by monitoring:
1. Token usage tracking
2. API cost monitoring
3. Resource utilization
- Quality Metrics: Evaluates system effectiveness by measuring:
1. Response relevance
2. Hallucination detection
3. Consistency checks
3. Visualization Layer:
- Interactive Dashboard: Monitors and analyzes data in real-time.
- Alert System: Contains a proactive notification system for issues
- Analytics Reports: Analyzes detailed insights and trends
Next, explore the implementation process of Langfuse for LLM observability.
How can Langfuse be Used for LLM Observability?
Here are the steps that you can follow to implement LLM observability using Langfuse:
A. Quick Setup
1. Install the Langfuse SDK using this code:
pip install langfuse
2. Set up your environment variables using this code snippet:
export LANGFUSE_PUBLIC_KEY="your-public-key"
export LANGFUSE_SECRET_KEY="your-secret-key"
3. Next, add decorators to your existing code like this:

B. Trace Structure
Langfuse automatically generates traces that capture the flow of a request and its related activities. Each trace includes:
- Overall Operation: Represents a single user request.
- Nested Observations: Multiple layers of observations within the trace.
It’s important to stay informed about these observation types:
- Events: Specific, discrete occurrences within the process.
- Spans: Time-bound units of work, such as API calls or processing steps.
- Generations: Specific output generated by the AI model.
C. Advanced Usage and Cost Tracking
For more detailed tracking, you can access the context within the decorated functions:
from langfuse.decorators import observe, langfuse_context
@observe(as_type="generation")

After completing the setup and configuration of the steps above, here’s what a typical Langfuse dashboard will look like:

Fig: Langfuse Dashboard
Note: Trace details provide a deep dive into requests, mapping events, spans, and generations. This helps developers debug execution paths, pinpoint issues, and optimize LLM performance efficiently.
Here’s a screenshot of the trace details:

Fig: Trace Details
Head to the final sections of this blog to explore key monitoring considerations and best practices.
What are the Advanced Monitoring Aspects for LLM Applications?
From tracking the flow of requests to optimizing retrieval systems, advanced monitoring plays a crucial role in maintaining efficiency and quality. Here are some key aspects for monitoring LLM applications:
1. Traces and Spans in Agentic Workflows
Modern LLM applications often employ complex workflows involving multiple steps and components. Tracing capabilities help monitor the complete execution flow, from initial request to final response. Each span in a trace represents a distinct operation. This allows teams to:
- Track individual components and their interactions
- Identify bottlenecks and failure points
- Understand latency at each processing step
- Debug issues by following the complete request path
2. Search and Retrieval Optimization
For applications using Retrieval Augmented Generation (RAG), observability of the search and retrieval process is crucial. This involves monitoring:
- Quality and relevance of retrieved context
- Performance of embedding systems
- Accuracy of retrieval strategies
- Impact of retrieved context on final outputs
3. Prompt Engineering and Management
Effective prompt engineering requires careful monitoring and iteration. Here, LLM observability systems track:
- Token usage and costs per prompt
- Response quality for different prompt versions
- Performance across different use cases
- Prompt template effectiveness
Continue reading to learn the best practices for implementing observability.
What are the Best Practices for Implementing LLM Observability?
Here are the best practices that you can follow to implement LLM observability:

Fig: Best Practices for Implementing LLM Observability
1. Comprehensive Monitoring Strategy:
- Monitor every component of your LLM pipeline.
- Track both technical metrics and business KPIs.
- Implement detailed logging at appropriate levels.
- Set up alerting for critical issues.
- Regularly review and adjust monitoring parameters.
2. Cost-Effective Optimization:
- Track token usage across different models and components.
- Monitor cost per request and aggregate costs.
- Implement cost allocation tracking for different use cases.
- Set up budgeting and alerting systems.
- Regularly analyze cost patterns for optimization opportunities.
3. High-Quality Assurance:
- Implement systematic evaluation frameworks.
- Track user feedback and satisfaction metrics.
- Monitor hallucination rates and patterns.
- Set up automatic quality checks.
- Regular review of quality metrics and trends.
4. Efficient Performance Tracking:
- Monitor latency at each processing step.
- Track resource utilization across components.
- Implement performance benchmarks.
- Set up alerting for performance degradation.
- Regular performance optimization reviews.
Before we wrap up, I want to leave you with a few alternative options to explore. This is so you can find what works best for you when it comes to LLM observability and monitoring.
What Other Alternatives Can Improve LLM Observability and Monitoring?
Here are the other options that you can avail of, for improving LLM observability and monitoring:
a. Weave by Weights & Biases
Some of its key features include:
- Evaluation and Monitoring: Helps developers evaluate, monitor, and iterate on AI applications to enhance quality, latency, cost, and safety.
- Production Performance Tracking: Logs inputs, outputs, and metadata for debugging and performance improvement automatically.
- Integration Flexibility: Supports a framework- and LLM-agnostic approach with a broad range of pre-built integrations.
b. Arize Phoenix
Some of its key features include:
- Data Visualization: Enables quick performance evaluation and issue tracking.
- Telemetry Support: Integrates seamlessly with OpenTelemetry to monitor LLM applications effectively.
I’m wrapping up today’s read here!
With LLMs becoming increasingly central to modern applications, robust observability is evolving from a useful tool to a necessity. By implementing such monitoring and observability practices, teams can ensure their LLM applications remain reliable, cost-effective, and high-performing.
Remember that observability is not a one-time setup. It is in fact an ongoing process that requires regular attention and refinement. As your LLM applications evolve, your observability practices should evolve with them. These practices should always provide the insights needed to maintain and improve your systems.
I’m certain you would like to learn more about advanced GenAI-powered product engineering and software development services. Get in touch with us at Nitor Infotech.
LLM observability and monitoring are essential for keeping AI models accurate, reliable, and ethical. By tracking performance in real time, businesses can spot biases, errors, and security risks. This reduces misinformation and unintended issues. Monitoring also helps to improve efficiency, speed up responses, and ensure compliance with data regulations.