Big Data and Analytics | 05 Jan 2022 | 8 min
Understanding Geospatial Data

Let me ask you to think back to the last time you searched for a nearby restaurant, monitored the movements of a cyclone featured in the news, or looked up prominent tourist spots of the place you were going to visit next – in each of these scenarios, you happened to consume geospatial data. The information could be plain data or analytical reports – what is common is the fact that they represent a specific location. In my blog today, I’d like to help you to understand the meaning and types of geospatial data. Also read Part 2 of this series which is about GeoServer and Part 3 which is about. So, let’s dive in!
When a set of data encompasses geographic location as the reference component, it is referenced to as geospatial data. It represents some information about a specific location or over a range of a given location. The location can range from a specific point to a larger area. Oftentimes, Geospatial Information Systems (GIS) and geospatial data are used interchangeably. But we need to note a difference – GIS is actually the programmatic system that creates, stores, and analyses geospatial data.
There are two major kinds of geospatial data:
Read on to gain an understanding of both these types:
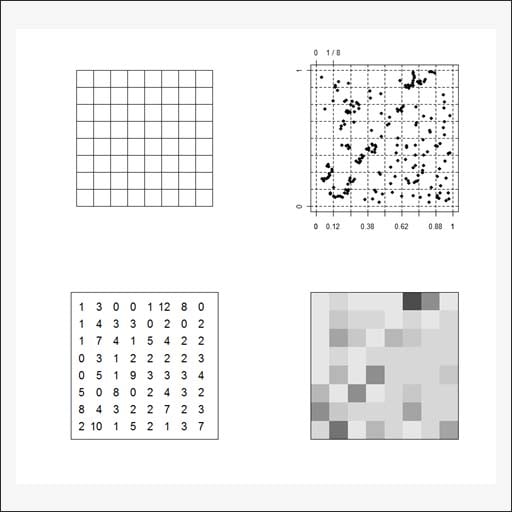
It is like a pixel-by-pixel digital image but has spatial reference. This helps associate the data to a specific location. The basic building block of a raster data is a cell/pixel. The geographical data in a raster format must hold an extent and its Coordinate Referencing System (CRS). The extent of a raster data represents the geographic area it encompasses. The CRS is a standard used to define the transformation of data from a geographical point to a flattened location on a map.

One of the most popular formats of raster data is a GeoTIFF file. It is a regular Tagged Image File Format (TIFF) image with added geo referential data which can tag the data to a location.
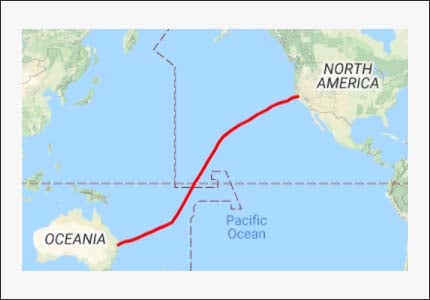
Vectors give specific feature information at discrete geographical locations. The location could be a simpleton point with (x,y) co-ordinates (specific location) or a collection of these (x,y) co-ordinates to represent a line (streets, rivers) or a polygon (lakes, grounds).
Data:
[
{ lat: 37.772, lng: -122.214},
{ lat: 21.291, lng: -157.821},
{ lat: -18.142, lng: 178.431},
{ lat: -27.467, lng: 153.027},
]
Representation:

Shapefiles are a widely used form of vector data. A shapefile consists of several files which include the main file (.shp), an index file (.shx), a dBase file (.dbf) and an optional projection file (.prj). The dBASE file contains attribute data for each shape in the main file. The projection file holds specifics about the spherical geometry; it is an optional but useful component of a shapefile.
In both raster and vector, one of the crucial elements of the data was its CRS. It is a system to project or convert points or actual location on the surface of the earth to the flattened 2D map. To achieve this, certain set of transformations are applied on the data based on its CRS. This means that data of same location associated with different projection will not align on the map when plotted. Once the correct projection is applied, only then they will plot on the correct and same location.
CRS has three major components:
There are common standard systems to store and transmit CRS data. Two of the universally used systems are EPSG and PROJ. Each of them is identified by a code. Often, we need to convert from one CRS definition to another, and you can find multiple useful resources to do so online. Different systems might use different standards but the ability to transform from one of these definitions to another makes the referencing system highly interoperable.
With this whole new understanding of geospatial data, it becomes interesting to see how we use our data and process it for visualization using the various standards available.
Feel free to write to us at Nitor Infotech if you would like to share your views on geospatial data and learn more about our big data and advanced analytics services that can help your business to garner fruitful insights and heighten efficiency.

we'll keep you in the loop with everything that's trending in the tech world.
