I recently worked on a use case which needed to display custom layers on maps from vector datasets like shapefiles, pull data from a spatial database, and render with styling options. It needed to convert data from various formats into something that could be visualized and integrated with an angular application using leaflet as the base map layer.
The initial assumption was that all this would be achievable through just running queries on a geospatial database. Querying on the database would generate GeoJSON which can be used to render the data on top of the map layer. However, that left a lot of responsibility on the frontend to process the complex set of data. As the data size increased, the space and time complexity increased on both the backend and the frontend. After considering the usage of a map server, it was clear that Web Map Service (WMS) layer would be the way to solve this problem. WMS is a standard service used by map servers to deliver map images which can be layered on top of a map as a map layer. Web Feature Service (WFS), on the other hand, is a service that can be used to query, update, delete feature data sets. To differentiate, any image format like GeoTiff, PNG, SVG, Tiff etc. are WMS layers and datasets like GeoJSON, Shapefile, KML are WFS layers.
GeoServer is one such map server. It is an open-source server written in Java that facilitates the sharing, processing, and editing of geospatial data. In this blog, I am going to take you through the installation and setup process of GeoServer and share the details of how to use it. Before you read on, I suggest you check out my previously published two blogs in this series – ‘Understanding Geospatial Data’ and ‘Getting Started with PostGIS’.
On that note, let’s get started!
Installation and setup of GeoServer
It is a Java application which can be installed on any machine having jdk/jre installed. It needs a decent amount of processing power and RAM to support multithreading. It will also need storage, based on the data you are storing. Follow the steps given below to get started:
- Download GeoServer here: http://geoserver.org/download/
- Copy the binary into a location of your choice and navigate to the bin folder: C:\geoserver-2.17.1-bin\bin
- Click on startup.bat to start the server (Needs JDK 8 or 11)
- Once the server is up, go to http://localhost:8080/geoserver/web/
- Log in using default credentials which should be updated for production: username: admin and password: geoserver
- Once you are logged in, create a new workspace for your work
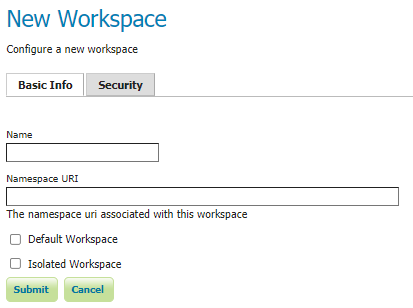
Image
To avoid any issues with CORS while using the layers with frontend, update the web.xml file in: C:\geoserver-2.17.1-bin\webapps\geoserver\WEB-INF with the following mapping information.
<filter>
<filter-name>cross-origin</filter-name>
<filter-class>org.eclipse.jetty.servlets.CrossOriginFilter</filter-class>
<init-param>
<param-name>chainPreflight</param-name>
<param-value>false</param-value>
</init-param>
<init-param>
<param-name>allowedOrigins</param-name>
<param-value>*</param-value>
</init-param>
<init-param>
<param-name>allowedMethods</param-name>
<param-value>GET,POST,PUT,DELETE,HEAD,OPTIONS</param-value>
</init-param>
<init-param>
<param-name>allowedHeaders</param-name>
<param-value>*</param-value>
</init-param>
</filter>
Configuring Data Source
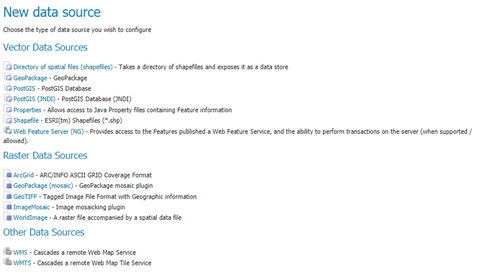
GeoServer allows you to configure raster and vector data sources, both of which can be then rendered in the preferred format as a layer. From the left-hand side pane of the application, select “Stores”. This opens the “Manage stores” section showing pre-existing stores which are configured by default. To add a new store, click on the “Add new store” button and select the kind of store you’d like to configure.
Configuring PostGIS database as a data source:
This will connect GeoServer to your geospatial database PostGIS. Once the connection is established, you can query on any of the database tables geospatial data to generate layers.
Add the basic connection and pooling details:
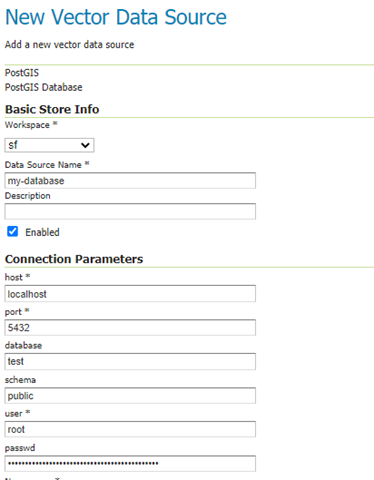
Make sure you are adding the details to the workspace you created to maintain logical separation.
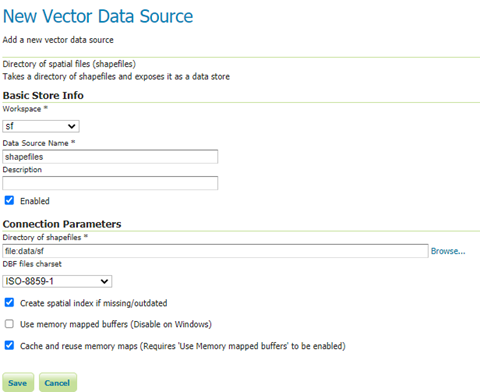
Configuring a directory of shapefiles as data source:
This data source points at a directory which holds shapefiles. This directory can either be within the GeoServer folders or anywhere in the system. These shapefiles can then be rendered in different WMS formats once they are published as a layer.
Publishing layers
Once you have set up the store from where you need the data, the next step is to create layers. In order to create a layer, select “Layer” from the left-hand side pane and click on “Add a new layer”. The next step is to select a data source. Based on the data source, you will get the available options which can be published as a layer.
Shapefile layers
Each shapefile in the selected directory can be published as a layer. To do so, select the data source created for the shapefile.
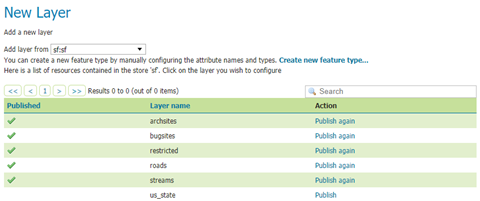
Click on the “Publish” action to add the other necessary details. A few key areas to focus on are:
- Coordinate reference systems – Select the correct CRS for which the shapefile was generated.
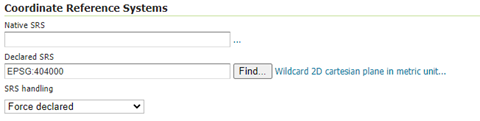
If default declared SRS is incorrect, click on “Find” and add the correct value. In this case it is 4326.
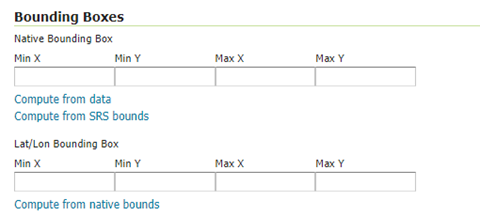
- Bounding boxes – Click on “Compute from data” for GeoServer to figure out the boundary lines for your shapefile data.
- Feature type details – This represents the properties and the geom type being represented by the layer. It could represent point coordinates, line string, polygon, or multi-polygon. Additionally, the files could also hold information like name, description, etc.
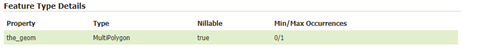
If you think the property present in the shapefile is not getting added to the feature details, consider uploading the corresponding .dbf and .prf file into the data source directory.
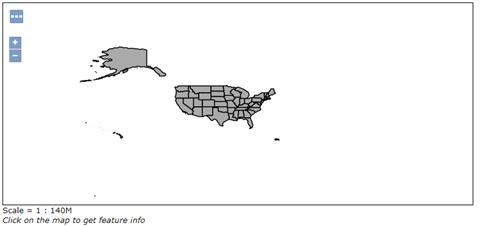
Once all the details are added, publish the layer. To view the layer, click on the “Layer Preview” option from the left pane and search for your newly created layer.
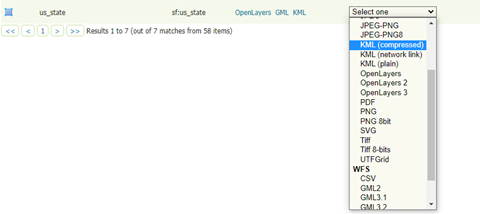
Select the layer format you want to view it in from the dropdown. Let’s look at the WMS tile layer using the open layer standard. This is the us_state layer we published.
This layer can be layered on top of a map using the layer endpoint:
http://localhost:8080/geoserver/${workspace}/wms?service=WMS&version=1.1.0&request=GetMap&layers=${workspace}%3A${layername}&bbox=-179.231086%2C-14.601813%2C179.859681%2C71.441059&width=768&height=330&srs=EPSG%3A4326&format=${format}
PostGIS layers:
Once the database store is added, click on the “Layer” option from left pane and click on the “Add new layer” option. Select the PostGIS datasource option. It will list all the tables present in the database.

Publish the layer you would like to render; follow the same steps as above for shapefiles. Based on the kind of data, the layer will be generated. If the data is a collection of Point features, you will see something similar to this in the preview:
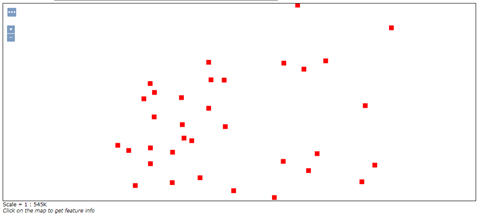
If you look at the Feature Details of this layer, you will notice that the geom is Point, unlike MultiPolygon in the shapefile layer.
| geom | Point | true | 0/1 |
A layer can also be generated by querying the database instead of using the whole table as a layer. Click on “Add new layer” and you will see the following options when you select the PostGIS store as a data source:

Select “Create new SQL view” and fill out the query in the given text area:
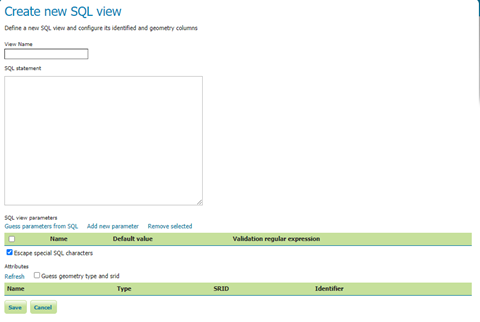
Here is a sample query to fetch the data for all US states with a population greater than 10 million. This layer will only return the states fitting the given criteria.
Select
"us_states"."name",
"us_states "."population",
"us_states "."location" as geom,
from
" us_states " as " us_states "
where
"us_states"."population" > 10000000
Adding Style to Layers
To add style to an existing layer, select “Styles” from the left pane. This will show a list of existing styles for different variants of coordinates. You can either use a predefined style or create a new one and assign it to your layer. Let’s add an existing style to the us_state layer created previously. Select a style and look into the style editor. It provides an XML stylesheet. If you want, you can update the existing XML. The following XML will make the states of #75E6DA color.
<?xml version="1.0" encoding="UTF-8"?>
<StyledLayerDescriptor version="1.0.0" xmlns="http://www.opengis.net/sld" xmlns:ogc="http://www.opengis.net/ogc"
xmlns:xlink="http://www.w3.org/1999/xlink" xmlns:xsi="http://www.w3.org/2001/XMLSchema-instance"
xsi:schemaLocation="http://www.opengis.net/sld http://schemas.opengis.net/sld/1.0.0/StyledLayerDescriptor.xsd">
<NamedLayer>
<Name>area landmarks</Name>
<UserStyle>
<Title>Border-less blue fill</Title>
<Abstract>Light blue polygon fill without a border</Abstract>
<FeatureTypeStyle>
<Rule>
<PolygonSymbolizer>
<Fill>
<CssParameter name="fill">
<ogc:Literal>#75E6DA</ogc:Literal>
</CssParameter>
<CssParameter name="fill-opacity">
<ogc:Literal>1.0</ogc:Literal>
</CssParameter>
</Fill>
</PolygonSymbolizer>
</Rule>
</FeatureTypeStyle>
</UserStyle>
</NamedLayer>
</StyledLayerDescriptor>
Once done with the update, switch to the “Publishing” tab on top and select the layer you want to apply it to. You can either mark it as the default style or an associated style. In case of default, if no style is provided, the default style is picked up. But you can also provide one of the associated styles as the style for a specific request.
http://localhost:8080/geoserver/${workspace}/wms?service=WMS&version=1.1.0&request=GetMap&layers=${workspace}%3A${layername}&bbox=-179.231086%2C-14.601813%2C179.859681%2C71.441059&width=768&height=330&srs=EPSG%3A4326&format=${format}&style=giant_polygon
You can also do a quick preview of the applied style changes on your layer by navigating to the “Layer Preview” tab.
The layer now looks like this:
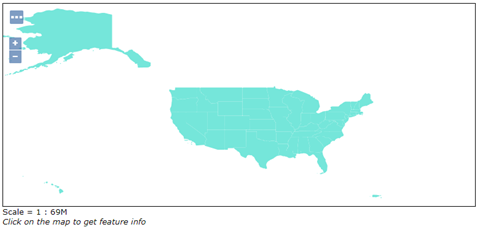
The stylesheet can also be used to add data on the layers, including names of the locations, legend or any other property attached with the feature details.
And that’s how you can kickstart your journey with GeoServer! I hope this blog has helped you gain a basic understanding of how to install and set up GeoServer. There are many more customizations and transformations of data that can be performed using GeoServer such as loading of raster data as a data source, grouping of layers to provide multiple layers at one request, caching, and tile layers.
Also feel free to write to us at Nitor Infotech if you’d like to share your comments and suggestions and learn more about our Big Data Engineering services to see how you can manage voluminous data from disparate sources for your business.