Predictive analytics empowers organizations to anticipate future trends instead of merely reacting to past data. By integrating machine learning with Tableau, businesses can transform static reports into dynamic dashboards that provide actionable insights, forecasting sales, customer churn, and inventory needs. Tableau offers built-in forecasting tools using ARIMA models and supports integrations with Python (TabPy) and R for advanced modeling.
This combination enables proactive, data-driven decision-making, enhances competitive edge, and simplifies complex data visualization, ultimately driving smarter operational strategies with real-time insights tailored to specific business needs.
Is your data helping you stay ahead or just keeping you informed? Well, traditional analytics focus on what has happened, not what’s coming next. Without the ability to anticipate future trends, organizations may risk reacting too late, losing a competitive edge, and missing growth opportunities. This is where predictive analytics and machine learning (ML) make a difference. They enable organizations to uncover patterns in customer behavior, sales trajectories, and key metrics before they unfold.
Tableau, a leader in data visualization, takes this further by embedding predictive capabilities directly into dashboards. It transforms static reports into forward-looking insights that drive smarter, data-driven decisions.
This blog will delineate the process of embedding machine learning (ML) models within Tableau by seamlessly integrating predictive analytics. This transformation will elevate your dashboards into sophisticated, forward-thinking instruments that enable strategic, data-driven decision-making.
So, let’s get started with the basics!
What is Predictive Analytics and How Does it Work in Tableau?
Predictive analytics refers to the usage of statistical algorithms, machine learning, and data mining to analyze historical data and forecast future outcomes. These predictions can be used to:
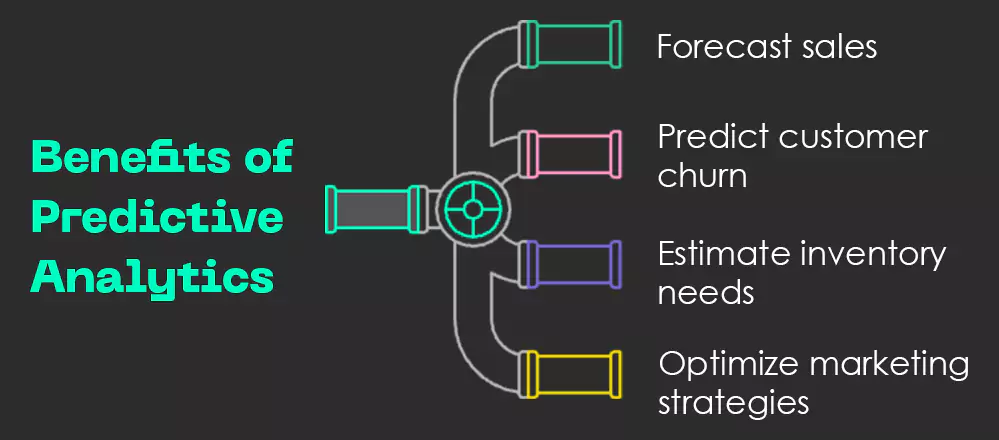
Fig: Benefits of Predictive Analytics
Fun fact: Having predictive analytics on your side is like having a data-powered psychic on your team—except it actually works.
When it comes to Tableau, there are multiple ways to integrate predictive analytics, including:
- Built-in Forecasting: Simple time-series forecasting using ARIMA models.
- TabPy (Python Integration): Allows users to execute Python machine learning models directly in Tableau.
- R Integration: Use R for advanced statistical models and machine learning techniques.
Why should you integrate predictive analytics with Tableau? The answer lies in the next section!
Why Integrate Predictive Analytics with Tableau?
The primary impetus for integrating predictive analytics and machine learning (ML) into Tableau lies in empowering businesses to make more strategic, data-driven decisions. Predictive analytics uses past data to predict future trends. This is while machine learning creates customized models that adjust as new data comes in.
Together, these technologies enable businesses to anticipate future developments. They also enable them to do so with precision, unlocking unprecedented insights and driving proactive, impactful decision-making.
Here’s are some of the key benefits of integrated predictive analytics with Tableau:
- Proactive Decision-Making: Rather than reacting to trends, organizations can act ahead of time.
- Data-Driven Forecasting: Businesses can use it to anticipate customer behavior, sales growth, and more.
- Enhanced Visualization: Tableau’s ability to visualize predictive data helps in understanding complex forecasts in a simple, intuitive manner.
While predictive analytics offers immense value, there might be some challenges businesses face when incorporating it.
Let me break it down next!
What Makes Predictive Analytics Implementation Challenging?
Here are some of the challenges that businesses may face while incorporating predictive analytics:
1. Data Overload and Complexity
As businesses collect more data, it becomes difficult to manage and analyze large volumes. Predictive models require large, clean datasets to make accurate predictions. Handling vast amounts of complex data can overwhelm traditional tools.
2. Unreliable Predictions
Predictive models rely on the data they’re trained on. If the data is messy, incomplete, or not accurate, predictions can be wrong. Poor-quality data can lead to misleading insights. This can negatively impact business decisions.
3. Limited Machine Learning Expertise
Creating predictive models requires specialized knowledge of machine learning algorithms. Unfortunately, many businesses lack the expertise to build and implement these models. This limits their ability to fully take advantage of predictive analytics.
If there’s a challenge, there’s a solution! In the next section, you’ll explore key strategies to overcome these hurdles and seamlessly integrate predictive analytics into Tableau—making it one of the most crucial parts of this blog.
How Can You Seamlessly Integrate Predictive Analytics into Tableau?
To overcome these challenges, Tableau enables you to integrate predictive models directly into your dashboards, turning them into actionable tools for forecasting and decision-making.
Here are some of the ways to integrate predictive analytics in Tableau:
1. Tableau’s Built-in Forecasting Features
Tableau includes built-in forecasting tools that allow you to quickly predict trends based on time-series data. This feature uses algorithms like ARIMA (AutoRegressive Integrated Moving Average) to automatically detect patterns in your data and project them into the future.
For example: Imagine a retail business wants to predict future sales. By using Tableau’s forecasting feature, the business can visualize predicted sales for the next quarter, helping them plan inventory levels.
Here’s a screenshot for your reference:
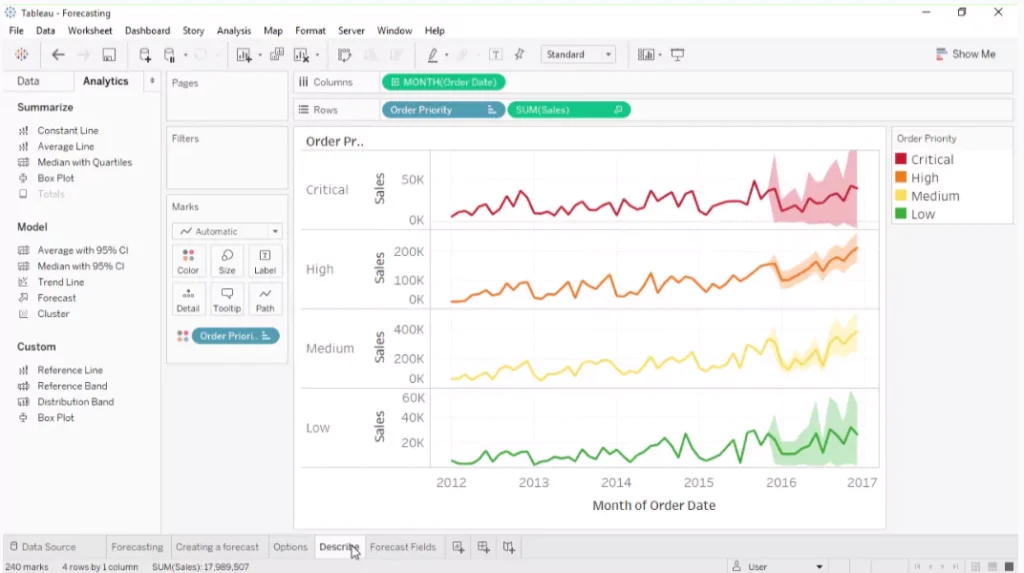
Screenshot: Tableau Forecasting
2. Python Integration (TabPy) for Custom Predictive Models
For more complex models, Tableau supports Python integration through TabPy. This allows you to run machine learning algorithms and data analysis directly within Tableau.
For example: Imagine a SaaS company aiming to predict customer churn by analyzing user activity patterns. By using a machine learning model built with Python’s scikit-learn, the company can integrate this model into Tableau using TabPy to forecast which customers are at risk of canceling.

Achieving 50% savings on licensing? Learn how our solution engineering and Power BI made it possible for a leading healthcare organization.
If you wish to know how, then here’s a breakdown for building a churn prediction system that uses Python for data preparation and model building (outside of Tableau):
a. Data Preparation and Model Building (Python – Outside Tableau)
Step 1: Gather Data
Collect user activity data, including:
- Login frequency
- Feature usage (e.g., time spent on specific features)
- Support ticket submissions
- Plan changes
- Billing information
- Customer demographics (e.g., industry and company size)
- Subscription start date
Step 2: Clean and Engineer Features
- Handle missing values (such as imputation and deletion).
- Convert categorical variables to numerical (e.g., one-hot encoding and label encoding).
- Create relevant features (e.g., days since last login, average feature usage per day, and time since last support ticket).
Step 3: Train a Scikit-learn Model
- Split data into training and testing sets.
- Choose a suitable model (e.g., Logistic Regression, Random Forest, and Gradient Boosting).
- Train the model on the training data.
- Evaluate the model’s performance (accuracy, precision, recall, F1-score, AUC).
- Save the trained model with pickle.
Here’s a Python script that outlines the process of building and saving a machine learning model for churn prediction:
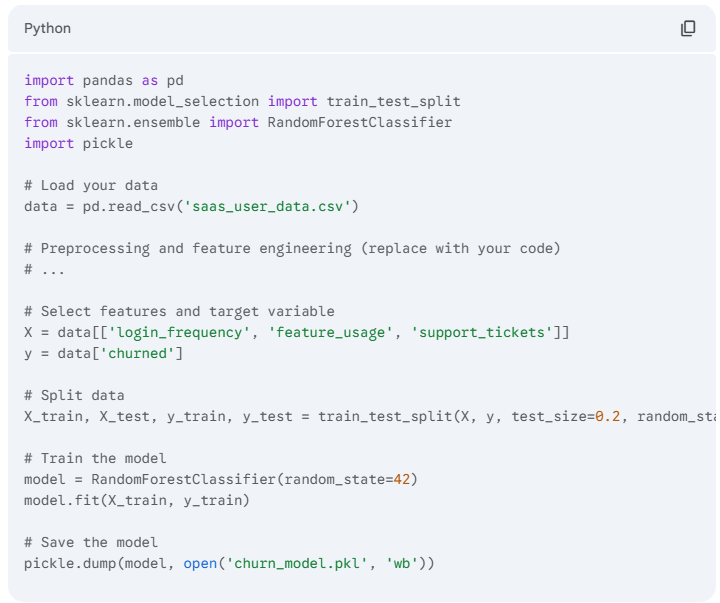
Screenshot: Skitlearn model Python script
Step 4: TabPy Setup
- Install TabPy on a server or your local machine.
- Configure TabPy by starting the TabPy server.
- To connect TabPy in Tableau, go to Help > Settings and Performance > Manage External Service Connection, Then enter the server address and port.
Step 5: Tableau Integration
- Connect Tableau to your SaaS user data.
- Create a calculated field for churn prediction. To do so, follow these steps:
1. Create a new calculated field.
2. Use the SCRIPT_REAL function to call the Python model:
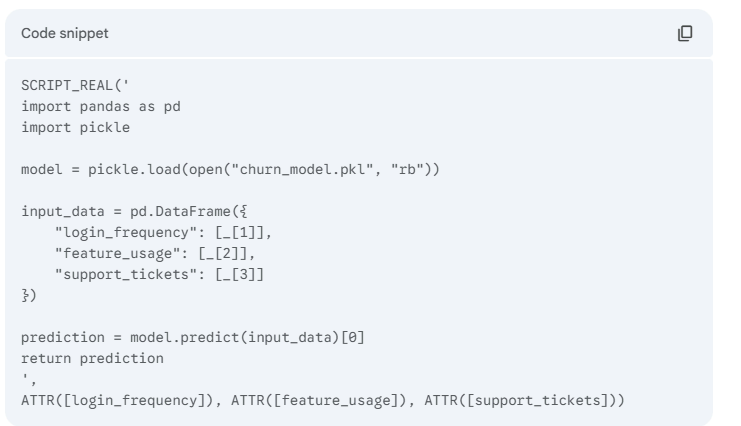
Screenshot: Integration with Python
Step 6: Dashboard Creation
- Build Interactive Dashboard: Combine visualizations into a dashboard.
- Add Filters and Actions: Enable data exploration to identify at-risk customers.
- Highlight High-Risk Customers: Use color coding or other visual cues to highlight customers with a high churn probability.
By following these steps, you can avail of key benefits such as:
- Real-time Predictions: Get up-to-date churn predictions based on the latest user activity.
- Actionable Insights: Identify specific customers at risk and take proactive measures.
- Improved Customer Retention: Reduce churn and increase customer lifetime value.
- Data-Driven Decisions: Make informed decisions based on data and predictive analytics.
3. R Integration for Statistical Modeling
Tableau can also integrate with R, a statistical computing language, which is ideal for building more advanced models for predictions, such as regression analysis or classification models.
For example: Imagine a financial services firm that uses R to predict stock market trends based on historical performance and external factors. The firm can then visualize these predictions within Tableau for better decision making.
For R integration, you need to follow these steps:
- Connect Tableau to R: Use the Rserve package to establish a connection between Tableau and R. This allows Tableau to send data to R and receive the results back.
- Create Calculated Fields in Tableau: Use Tableau’s calculated fields to call R functions. For example, you can create a calculated field that sends data to an R model for prediction and returns the results to Tableau.
- Build the Dashboard: Use Tableau’s drag-and-drop interface to create visualizations that display the predictions from the R model. You can use various chart types, such as line charts, bar charts, and scatter plots, to visualize the predictions.
- Interactive Elements: Add interactive elements like filters, parameters, and tooltips. These elements will make the dashboard more user-friendly and insightful.
Here’s an image that illustrates the integration of the R programming language with Tableau for enhanced data analysis and visualization:
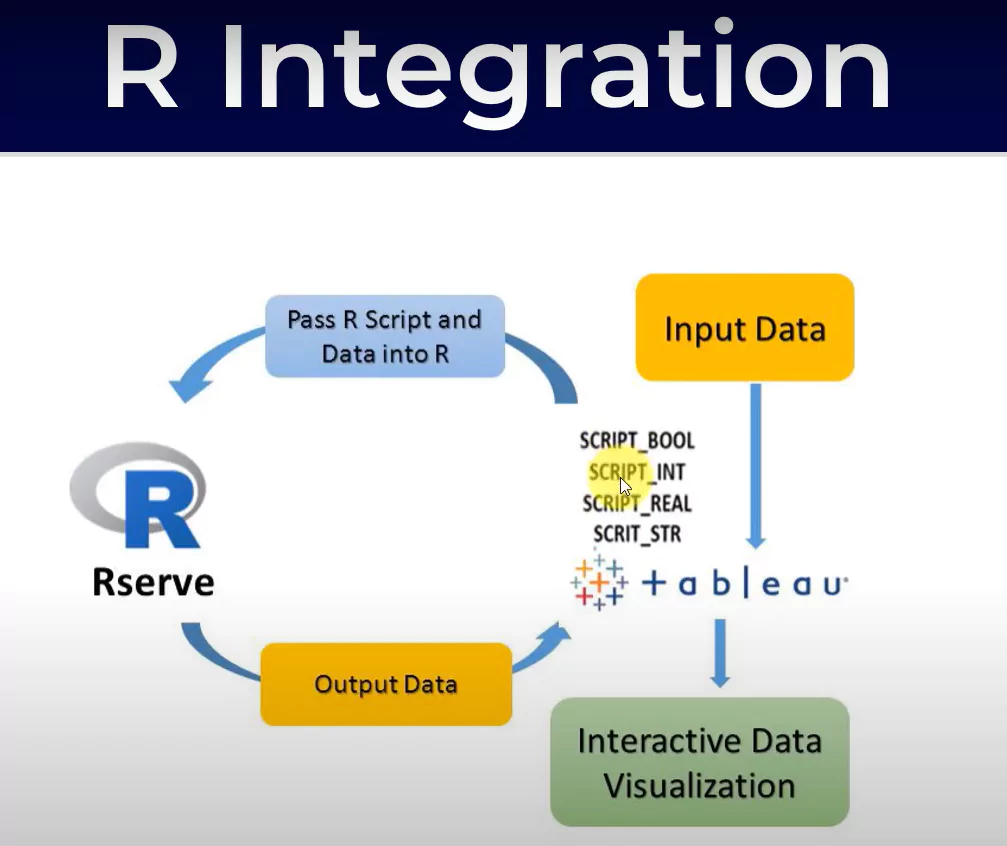
Screenshot: R Integration
4. Extensions for Cloud-Based Machine Learning
Tableau also supports extensions that integrate cloud-based machine learning models, such as AWS SageMaker or Google Cloud AI. These models can provide predictions in real-time. This allows businesses to make decisions based on the most current data available.
For example: Imagine a logistics company using AWS SageMaker to predict delivery times based on traffic patterns and weather forecasts. By integrating this with Tableau, they can adjust delivery schedules and allocate resources more efficiently.
In case you wish to understand the integration, here’s a simplified read:
- AWS SageMaker:
1. This is where the machine learning models are built and deployed. In the logistics example, SageMaker models analyze historical delivery data, traffic patterns, weather forecasts, and other relevant factors to predict delivery times.
2. These models are hosted as endpoints, allowing other applications (like Tableau) to query them for predictions.
- Tableau:
1. Tableau will connect to the SageMaker endpoints, sending data and receiving predictions.
2. Tableau will then visualize these predictions. This will enable logistics managers to gain actionable insights.
Here’s an overview of the visualization the logistics company can create to enhance insights and decision-making:
Delivery Time Forecast Map: A map of the delivery area, with color-coded routes or zones indicating predicted delivery times.
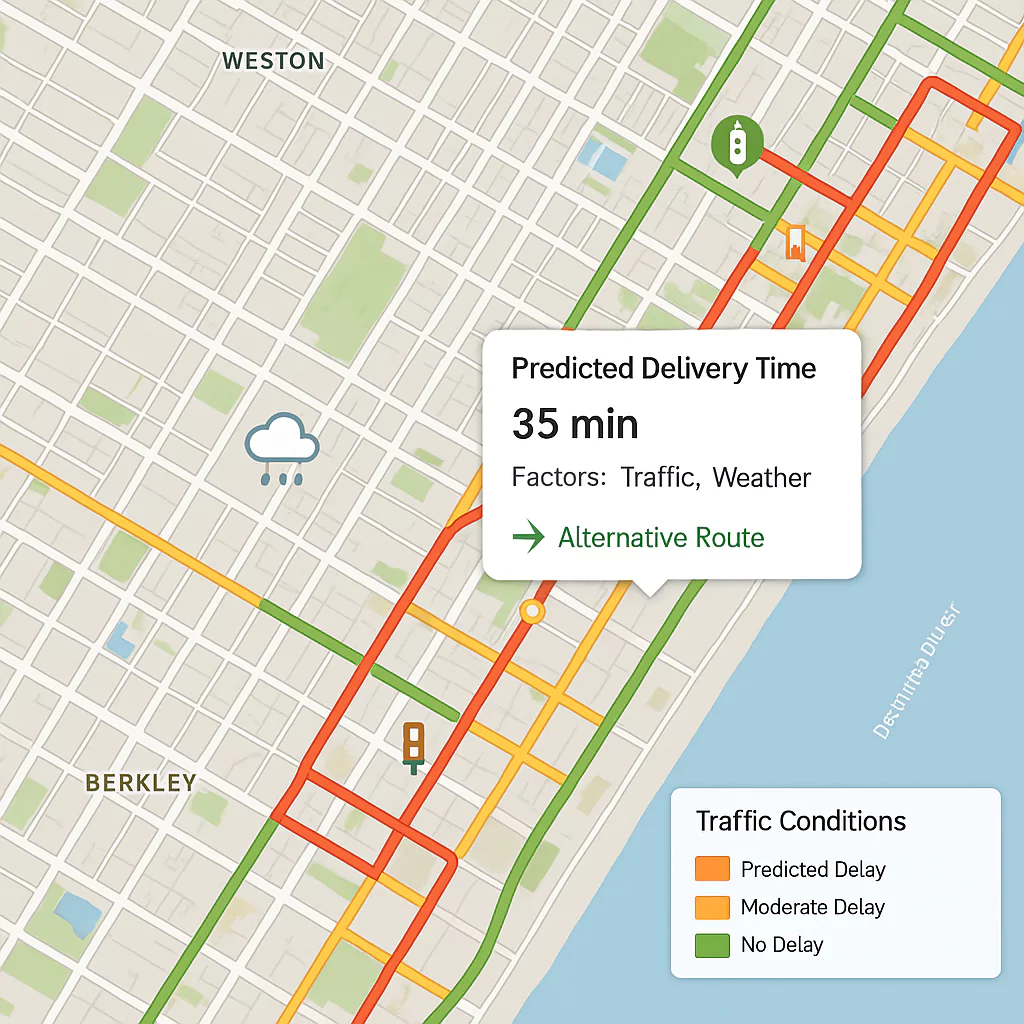
Screenshot: Forecast Map
Screenshot Description:
- This map highlights predicted delays in red and efficient routes in green. This provides a clear visual guide for navigating the city.
- Tooltips can display detailed information, such as the predicted delivery time, the factors contributing to the prediction (e.g., traffic and weather), and suggested alternative routes.
And there you have it—four ways to seamlessly integrate predictive analytics with Tableau!
Before closing the curtains, I’ll talk about more real-world applications of predictive analytics in Tableau. So, read the last bit!
What Are Some Real-World Use Cases of Predictive Analytics in Tableau?
Here are some real-world applications of predictive analytics in Tableau:
1. Sales Forecasting for Retail
Scenario: A retail business wants to predict sales for the upcoming season. By integrating Tableau’s built-in forecasting capabilities with historical sales data, the business can predict sales trends for the next quarter. This enables better inventory management, optimized marketing strategies, and proactive staffing.
The clothing retailer can forecast an increase in sales for winter apparel. Using Tableau, they can predict a 15% increase in sales compared to last year, which helps them stock up on winter clothing early.
Refer to this screenshot for a better understanding:
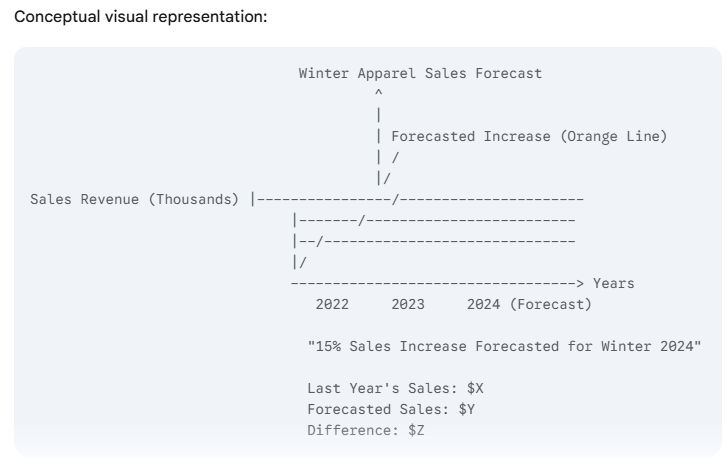
Screenshot: Sales Forecasting
2. Predicting Customer Churn in SaaS
Scenario: A SaaS company uses machine learning to predict customer churn. By leveraging TabPy and integrating Python with Tableau, the company can create a churn prediction model that evaluates user behavior, such as feature usage and support interactions.
The company can identify users with a high churn risk and proactively engage them with personalized offers or support. Tableau dashboards can help visualize which customers are most likely to churn. This can make it easier to focus retention efforts on high-risk segments.
Refer to this screenshot for a better understanding:
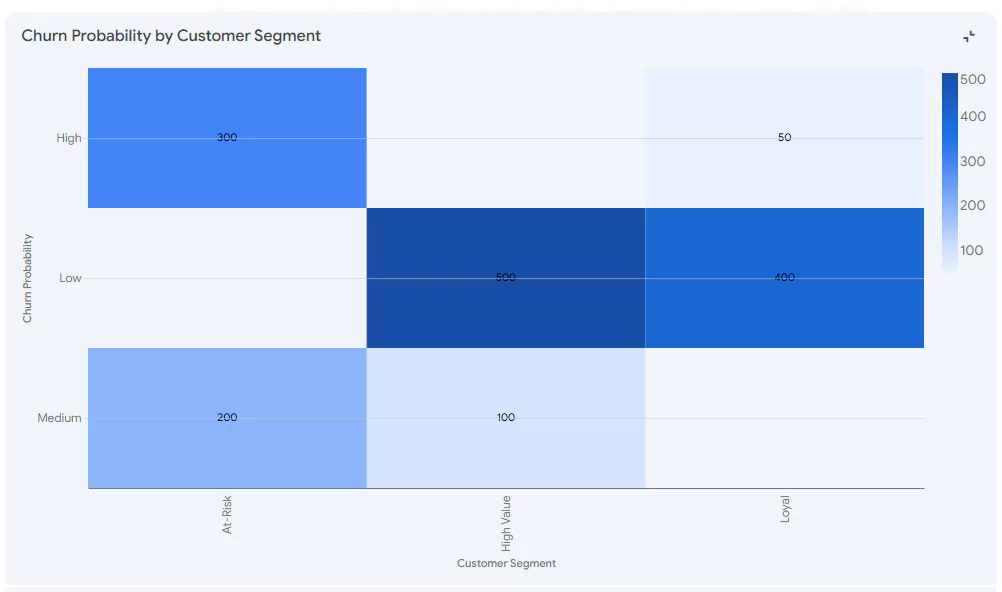
Screenshot: Predictive Customer Churn
3. Demand Forecasting in Manufacturing
Scenario: A manufacturing company wants to predict future demand for its products based on historical sales, market trends, and external factors like holidays. They can use Tableau’s forecasting feature to predict sales volume and adjust production schedules accordingly.
By forecasting a % increase in demand for a specific product during the holiday season, the company can optimize production. This ensures they meet customer needs without overstocking.
Refer to this screenshot for a better understanding:

Screenshot: Demand Forecasting
Thought this is the end of this blog? Not just yet—I’ve got one last bonus section for you!
What Are Some of the Best Practices to Integrate Predictive Analytics in Tableau?
Here are the best practices that you can follow to seamlessly integrate predictive analytics in Tableau:
- Set Up Your Data: Clean and prepare your historical data. Ensure it’s structured and ready for analysis.
- Leverage Built-in Features: Start with Tableau’s built-in forecasting tools for time-series data. They are easy to use and require no coding.
- Explore Python or R Integration: If you need more advanced predictive models, set up TabPy or R integration and build custom machine learning models.
- Monitor and Adjust: Continuously monitor the performance of your predictive models and refine them based on new data.
That’s it!
So, by embedding predictive analytics and machine learning into Tableau, companies can gain valuable insights and a significant competitive advantage. Whether leveraging Tableau’s intuitive built-in features or advanced integrations with Python and R, predictive analytics will keep turning raw data into actionable foresight. Therefore, don’t simply analyze your data — anticipate the future and stay ahead of the curve.
I know you are curious about playing the serious sustainable and futuristic game with leading-edge technologies? Reach us at Nitor Infotech today, where we innovate and transform your vision into reality.