With the advancement of technology, the significance of database performance in sustaining the optimal functioning of a system or application has become increasingly evident. When an app is slow or a system doesn’t respond, it’s a sign that there might be problems with how the database is working. Therefore, to avoid such challenges, database performance testing is a must.
Wondering what is it?
Well, database performance testing identifies issues before deploying applications to end users. Load testing ensures your database apps perform well and are reliable under different user loads.
Among the myriad tools available for performance testing, JMeter stands out with its meticulous approach to simulating multiple users engaging with the database.
In this blog, you’ll discover JMeter and its role in database performance testing. Additionally, I’ll help you get a step-by-step breakdown of the testing process along with helpful best practices for success in your testing journey.
So, let’s start!
What is JMeter and why is it important for database performance testing?
Apache JMeter is a powerful open-source tool designed primarily for load testing. Over time, it has evolved into a versatile tool for different types of testing, including – functional, regression, and stress testing. It works seamlessly with various elements like web applications, APIs, and the backbone of data-driven systems – databases.
Here are the top 5 reasons showcasing the importance of JMeter for Database Performance Testing:
- Cross-Database Compatibility: JMeter’s ability is seamlessly interacting with many databases, both cloud-based and on-premises. From Amazon RDS (supporting MySQL, PostgreSQL, Oracle, and SQL Server) to Google Cloud Spanner, Microsoft Azure SQL Database, IBM Db2 on Cloud, and Snowflake, it paints a broad canvas for database testing.
- Real-World Simulation Proficiency: It is more than a testing tool; it’s a simulation expert. It effortlessly mimics real-world situations, facilitating – user loads, stress tests, and distributed testing scenarios like a digital conductor leading a valuable data ballet.
- Graphical User Interface (GUI) and Scripting Harmony: It seamlessly combines a user-friendly GUI for beginners with robust scripting support for experienced testers, offering flexibility in designing and executing database performance tests.
- Open-Source Versatility: Its widespread usage is not only because it’s free but also due to the massive community support. With ample documentation, forums, third-party assistance, and numerous plugins, it stands as a well-supported choice.
- Performance Metrics Mastery: It functions as a database performance testing metrics expert, precisely measuring response time and throughput. It provides detailed analyses of the average, minimum, maximum, and standard deviation of response times. Testers can use it to simulate diverse load scenarios, identifying potential issues.
For an in-depth exploration of each of these benefits and the best practices, stay tuned for my upcoming blog.
Moving ahead, let me help you run through the entire process of database performance testing with JMeter.
Steps for Database Performance Testing with JMeter
Before delving into the procedural steps, it’s crucial to ensure that you have these necessary prerequisites in place:
- Database: Select a database that aligns with the requirements of your project.
- Database Credentials: Ensure you have the required credentials to access the chosen database.
- User Permission: Depending on the specific operation you intend to perform, verify that you have the necessary user permissions.
- JMeter Installation: Make sure that JMeter is successfully installed on your machine.
Grabbed the necessaries? Great!
These 6 major steps are your gateway to seamlessly conduct database performance testing with JMeter:
Step 1: Adding Thread Group to Your Test Plan
Navigate through the steps below to incorporate the thread group into your test plan:
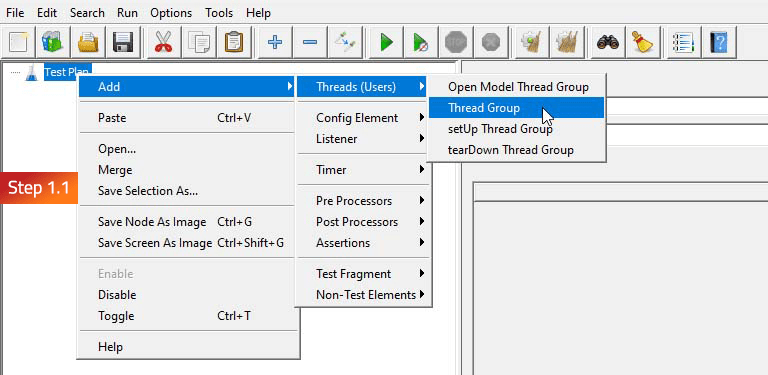
 Fig 1.1: Create the Test Plan and incorporate a Thread Group
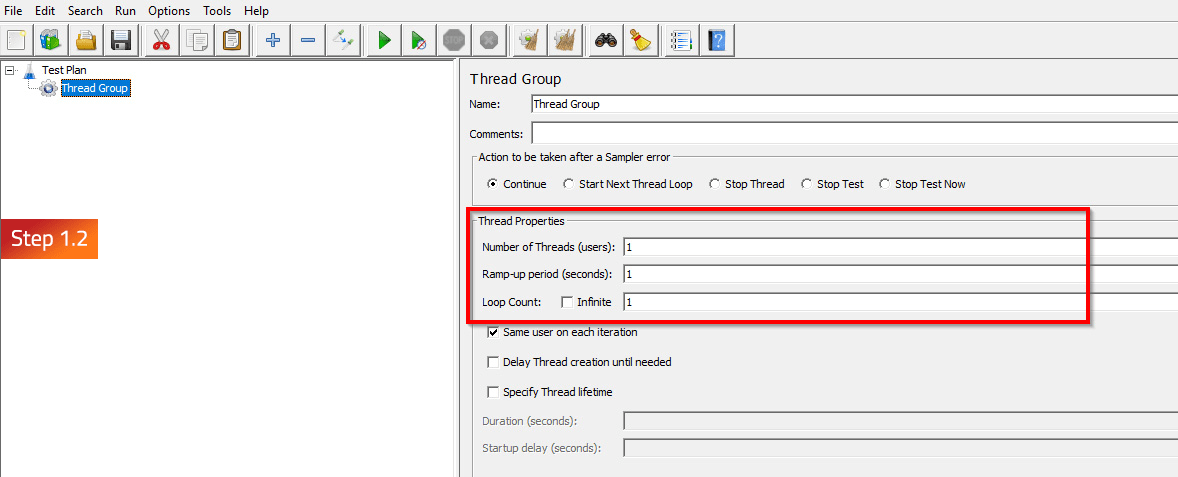
 Fig 1.2: Essential fields in the Thread group
Previous Next
- Step 1.1: Start by creating the Test Plan and incorporate a Thread Group into it.
Right-click on the Test plan > Click Add > Click Threads > Select Thread Group
- Step 1.2: Specify essential fields in the Thread group for performance testing:
- Number of Threads: Specifies the threads used in the load test.
- Ramp-Up Period: Sets the time to activate all threads. With 10 threads and a 30s ramp-up, one thread starts every 3s, reaching 10 threads in 30s.
- Loop Count: Determines test executions. Choosing Infinite means the test runs until manually stopped.
Step 2: Initiating Database Connection
Surf through the images below to initiate the database connection:
- Step 2.1: This step starts by adding a JDBC Connection Configuration config element in the test plan to facilitate the connection between JMeter and the database.
Right-click on Test plan > Add > Config Elements > JDBC Connection Configuration
- Step 2.2: Next, get the Database Connection Configuration ready:
- Database URL: jdbc: mysql://ServerName:PortNumber/SchemaName
- JDBC driver class: Select the driver class for the dropdown respective to your Database.
- Username and Password: Provide a valid Username and password for your database.
- Step 2.3: Choose the JDBC driver from the dropdown in the “JDBC Driver Class” field below.
Next, install the connector JAR file relevant to your database. For instance, if you’re using PostgreSQL, start by obtaining the PostgreSQL database driver.
- Steps 2.4 and 2.5: To accomplish this, visit Google and download the same concerning your Java version installed.
- Step 2.6: Then simply copy the file and paste it into the “bin” folder of your JMeter installation directory and restart JMeter. For instance, the path might be:
C:\apache-jmeter-5.5\apache-jmeter-5.5\lib
- Step 2.7: Create a variable for the pool. Feel free to choose any name that suits your preference.
Step 3: Creating the JDBC Request
Scroll through the images below to seamlessly create the JDBC Request:
- Step 3.1: After configuring the JDBC Connection, add a JDBC request.
Right-click on Test plan > Add->Sampler->JDBC Request
Note – Before defining a JDBC request, establish a valid database connection. This element enables the execution of SQL queries for test users.
- Step 3.2: Enter the Variable name created in the JDBC connection configuration to establish a connection between the configuration and the request.
- Steps 3.3 and 3.4: Select the Query type from the dropdown and write the SQL Query.
Quick read – Utilizing CSV files in database performance testing allows easy test parameterization and evaluation of multiple scenarios with minimal effort. This ensures consistent and repeatable test data for accurate performance testing.
Moving on to the next step!
Step 4: Configuring JMeter to read the CSV file
Walk through the images below to set up JMeter for CSV file reading:
- Step 4.1: Here, we need to first add a CSV Data Set Config element. Follow these steps:
Right-click on Test plan > Add > Config Elements > CSV data set config
Note – In the CSV Data Set Config element, you need to define the file path and variables for your test.
- Step 4.2: Adjust these parameters in CSV Data Set Config:
- Filename: Specify the full path and name of your CSV file.
- File encoding: Choose the encoding matching your CSV file’s character type.
- Variable Names: Enter comma-separated variable names, aligning with CSV column headers.
- Delimiter: Input the character separating values in each CSV column.
- Other Parameters: Leave blank unless specific requirements arise.
- Steps 4.3 and 4.4: Select the CSV file by clicking on Browse in the Filename field. Ensure variable names match the column names in the CSV files, adding multiple variables with commas.
Step 5: Adding Listeners
Follow the images below to add listeners to closely monitor and analyze detailed test results:
- Step 5.1: Start by adding a listener, like this:
Right-click on Test plan > Add > listener > View result tree
On clicking View Result Tree, you can see the JDBC requests will be completed successfully.
- Steps 5.2, 5.3, and 5.4: You can retrieve the executed query in the request section of the View Result Tree and observe the response in the response data.
– Then follow these steps:
Right-click on Test plan > Add > listener > View result in table.
Note – The View Results in Table listener in JMeter displays performance test script results in a sortable, filterable table format, exportable to CSV, XML, or HTML.
- Step 5.5: The listener then displays the results of the requests in tabular form from where you can generate the aggregate report, like this:
Right-click on Test Plan> Add > Listener> Aggregate Report
Refer to this image to learn about the columns in the table:

- Step 5.6: To see a summarized report, follow this:
Right-click on the Test Plan> Click Add > Select Listener> Generate Summary Report
Refer to this image to discover the contents of the report:

Step 6: Running the Test
Glide through the images below to run the test:
- Steps 6.1: Click on the thread group, provide the number of users, delay in seconds per user, and loop count for cycle repetition.
- Step 6.2: Once done, save the test details.
Note – Connect to your VPN with valid credentials if the database requires VPN access during the test.
- Step 6.3: Now start the test.
- Step 6.4: During the test execution, you can monitor for any potential errors and observe the current queue size of requests.
- Step 6.5: Click on listeners to review and analyze the performance across each fields.
- Step 6.6: View Result Tree.
- Step 6.7: View Results in table.
- Step 6.8: Check the Summary Report.
- Step 6.9: Check the Aggregate Report.
Congrats! You’ve completed database performance testing with JMeter.
Hence, database performance testing is pivotal in elevating user experience, identifying bottlenecks, and optimizing costs. It emerges as a solution for cultivating a resilient database ecosystem that seamlessly aligns with the core objectives of any business.
If you want to take your business to the next level with cutting-edge tech solutions, reach us at Nitor Infotech.


