If you have been looking for a robust application to ensure that the performance testing you do makes your users happy, your search could end with choosing JMeter. It would certainly be a good idea to automate performance testing using JMeter.
In my blog today, I’m going to introduce you to this handy application and its components. Let’s get started…
About JMeter
The Apache JMeter application is open-source software, a 100% pure Java application designed to load test functional behavior and measure performance. It was used for static and dynamic resources, web dynamic applications. JMeter files are simple XML.
JMeter uses different servers, applications, and protocols for testing, and here they are:
- Web-HTTP,HTTPS(java,nodeJs,PHP,ASP.NET)
- SOAP/REST Webservices
- FTP
- Database via JDBC
- LDAP
- TCP
- Java Objects
Now let’s take a look at what JMeter is made up of exactly.
Components of JMeter

Allow me to describe each of these components in detail.
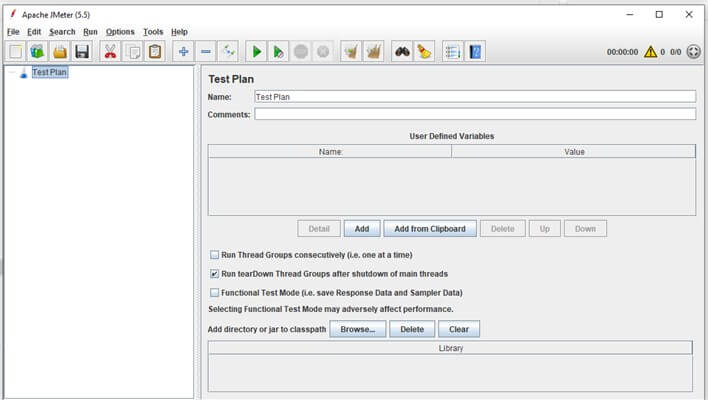
Test Plan:
The test plan is the starting element of the entire performance testing in JMeter.
Important Points about Test Plan:
- The test plan should be saved before running.
- JMeter files or test plans are saved in the form of JMX extension files.
- You can also save parts of the test plan as the different selection. Ex- If you want to save HTTP Request Sampler with Listener, you can save it as a test fragment so that it can be used in other test scenarios as well.
- Elements of Workbench are not saved with the test plan.

Discover the key performance testing methods to ensure your application meets SLAs and exceeds user expectations.
Thread Group
Thread: It is like a user to execute the scripts.
Thread Group: It is the set of users to execute the scripts. In that we will set iterations and ram-up-period.
Click on Test plan —–> Thread Group
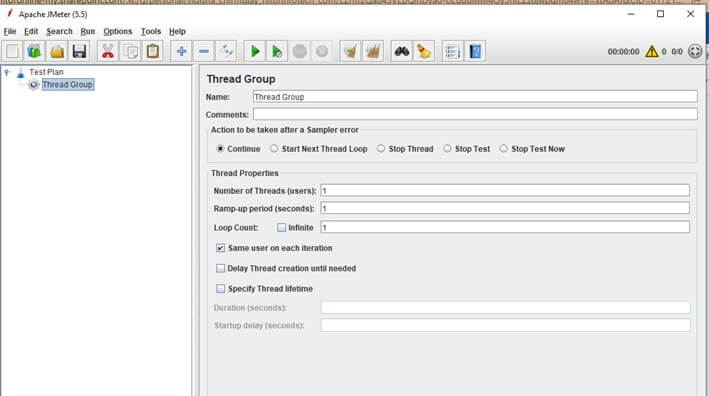
Number of Threads: It simulates the number of user(s) or connection(s) to your server application.
Ramp-Up Period: It means the number of users will add the given time period. It measures by seconds.
Loop Count: It means how many times the test will run. If you provide the iterations based on that many times the particular test will run. The infinite the test will run and so on. Like until you stop.
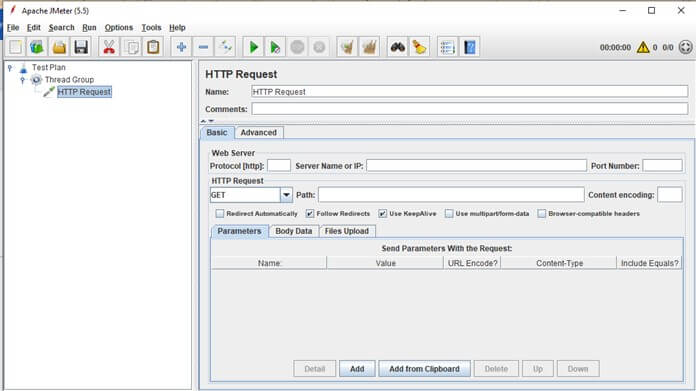
Samplers
Samplers permit JMeter to send particular kinds of requests to a server. A user’s request for a page from the target server is simulated. For instance, a HTTP Request sampler can be added in case you want to perform a POST, GET, DELETE on a HTTP service.
Some useful samplers are:
- HTTP Request
- FTP Request
- JDBC Request
- Java Request
- SOAP/XML Request
- RPC Requests
Take a look at this HTTP Request Sampler Control Panel:
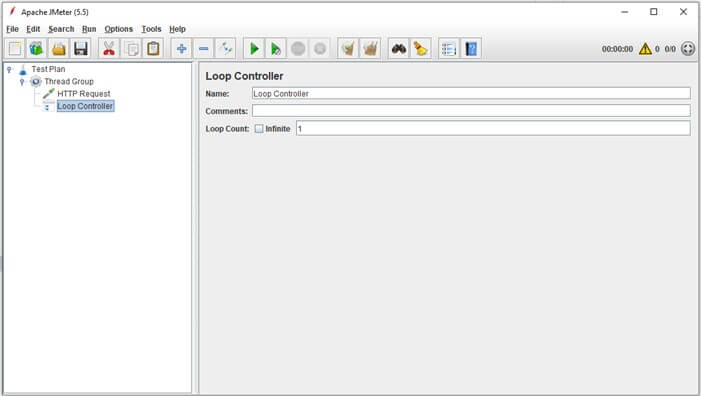
Logic Controllers
Logic Controllers allow you to take control of the sequence of processing of Samplers in a Thread. They could change the order of requests that arrive from any of their child elements. Some examples are: For Each Controller, While Controller, Loop Controller, IF Controller, Run Time Controller, Interleave Controller, Throughput Controller, Run Once Controller.
Take a look at this Loop Controller Control Panel:
Config Elements
Requests sent to the server can be further parameterized using some config elements which are executed before the actual request. A simple example of it could be reading values of a variable from a CSV file for which CSV Data Set Config is used.
Here are some of the important config elements used in the performance testing of the web and mobile applications:
- CSV Data Set Config.
- HTTP header manager
- HTTPS Cache Manager
- HTTPS Cookie Manager
- HTTPS Requests Default
- User Defined Variables
CSV Data set Config
It is a major element in the config element part. With the help of CSV data set we can do parameterization. It means that we can create the CSV data set file with the inputs, then we have to update it in JMeter.
Parameterization
The inputs given by the keyboard are parameterization.
It will run and execute the load test with given inputs with different user and different data.
You may ask, why is it required? Well, you can use it to generalize an action for a lot of users. In the event a test plan needs to execute for more than one user simultaneously, parameterization comes in useful. Here are the steps you should follow:
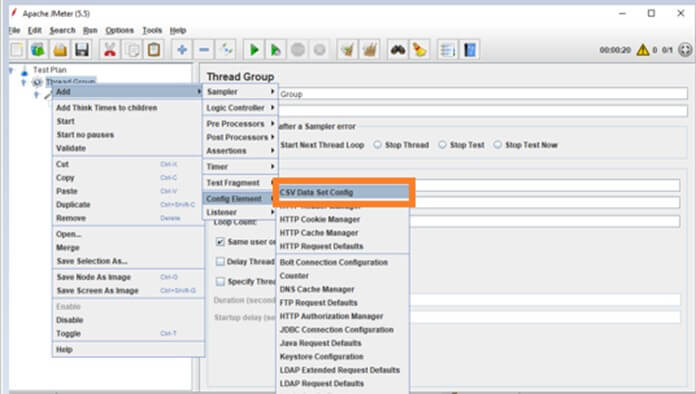
1. Click on Thread group-> Add->Config Element -> CSV Data Set Config.
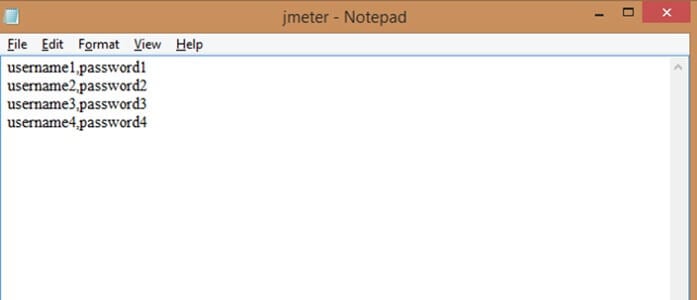
2. Open the bin folder from JMeter installation path. Create a text file and enter values into it. Now save the file with a suitable name and “.csv” extension. Store it in the Bin Folder.
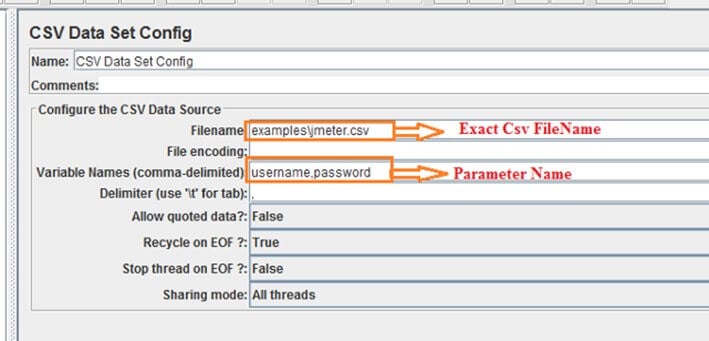
3. Now, open CSV Data Set Config and enter the exact file name and parameters.
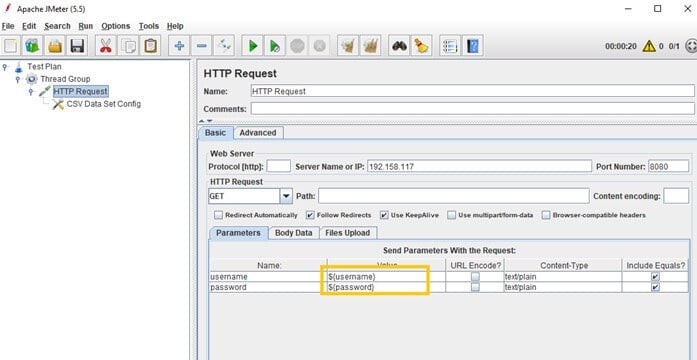
4. Choose the HTTP request where the CSV parameters are supposed to be passed in the value part of “Send Parameters With the Request” in form of “${username} and ${password}” as shown below.
5. Now all you need to do is run the script and verify the result for that Add > Listener > View result tree.

There you have it!
Regular expression extractor:
It means to find the dynamic value which are stored in script and through by the server.
Correlation
To handle the dynamic values which are through by the server. The process of capturing and storing the dynamic response from the server and passing it on to subsequent requests.
Regular Expression Extractor
1. Creating a Test Plan in JMeter
2. Adding Regular Expression Extractor in the Test Plan
3. Run and Validate the Test
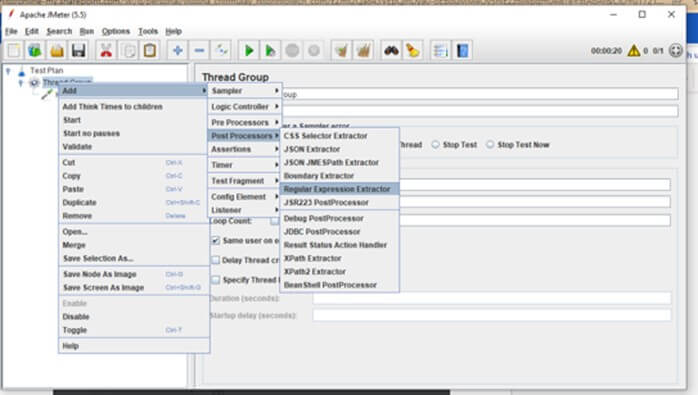
- After adding the Server Name in HTTP Request, you need to add the Regular Expression Extractor to extract some value from the Response of Step 1. Right Click on HTTP Request, choose Post Processors and include Regular Expression Extractor.
- Once you have added the Regular Expression Extractor, there are four important fields that you need to fill for successful extraction of some response value.
1. Name of Created Variable – Specify any variable name
2. RegularExpression – Add any Regular Expression that you want to obtain from the server
3. Template – Add the number of Groups in your Regular Expression
4. Match No. – Add any number of matches for your Regular Expression

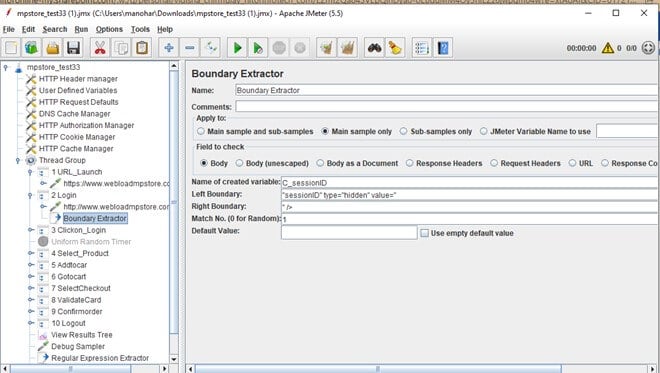
Boundary Extractor
Boundary Extractor is to capture the dynamic value from the response.
Sampler
Sampler is a request. It will through the request to server.
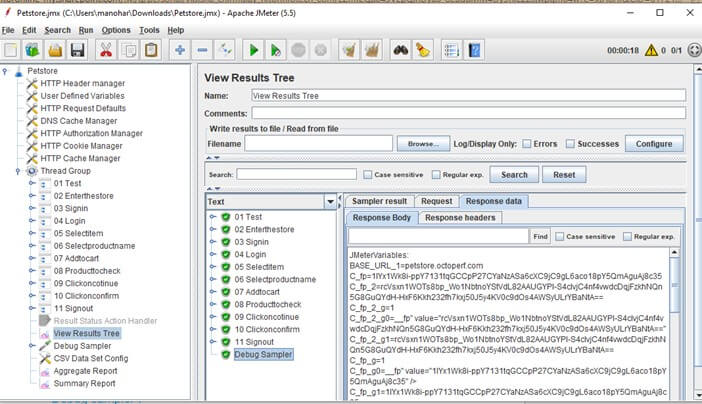
Debug sampler
With the help of debug sampler we can troubleshoot variable in script. Some scripts have problem or errors; to debug or avoid those, we will use this sampler using regular expression extractor.
Listeners
Listeners are the components with the help of listener we can store and view the results in JMeter. We can see the result in these different formats:
- View result tree
- View result table
- Summary reports
- Aggregate report
- Graphic results

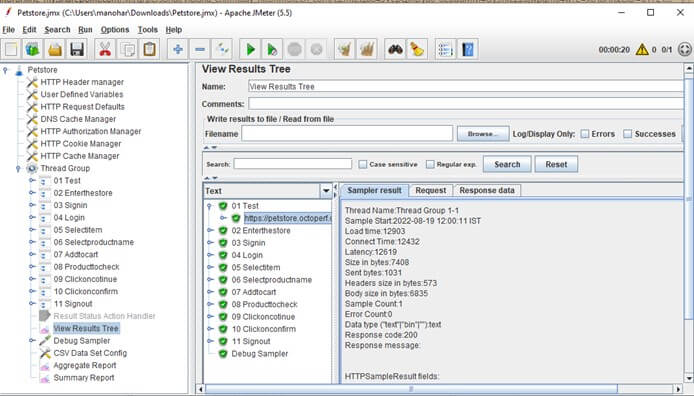
View results tree
In this format we can see the result tree shape. There we can see the sampler result, request body, and response data.
View result table
In this format, we can see the result in table format. There we can see Bytes and latency.
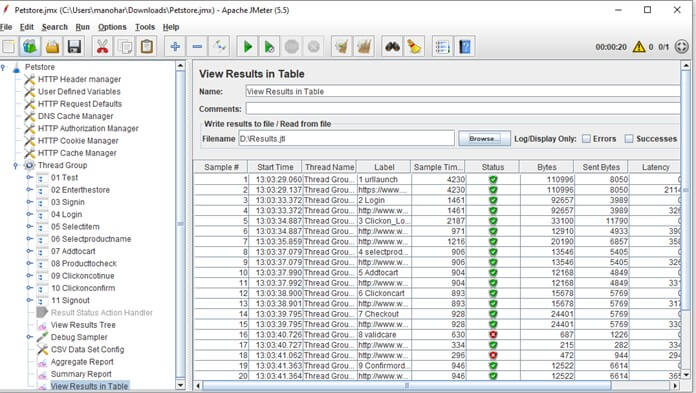
Latency
One user sends the request to server, the server will send the response to the user. While sending the response, there is a gap of some seconds – that gap is called latency.
Summary report
In this too, we can see the result in table format. There we can see the average throughput.
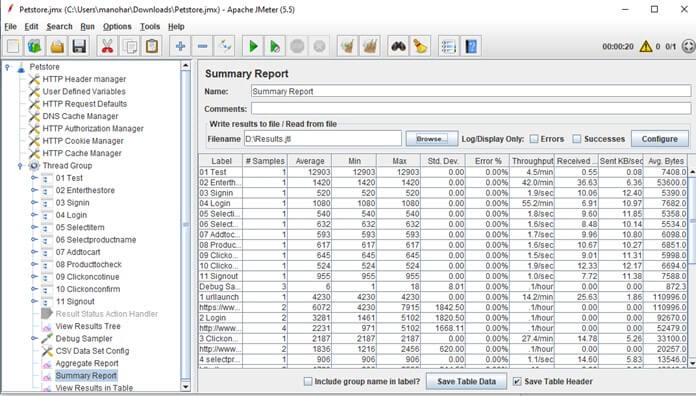
Throughput
Throughput will calculate the time at first sample to last sample.
Formula
No. of request/total time
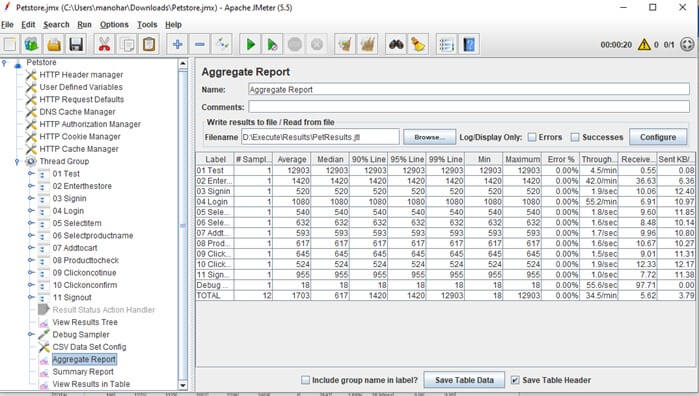
Aggerate report
In this format, we can see the result in table format, there we can see 90% line, 95% line, error % etc. Here is an example:
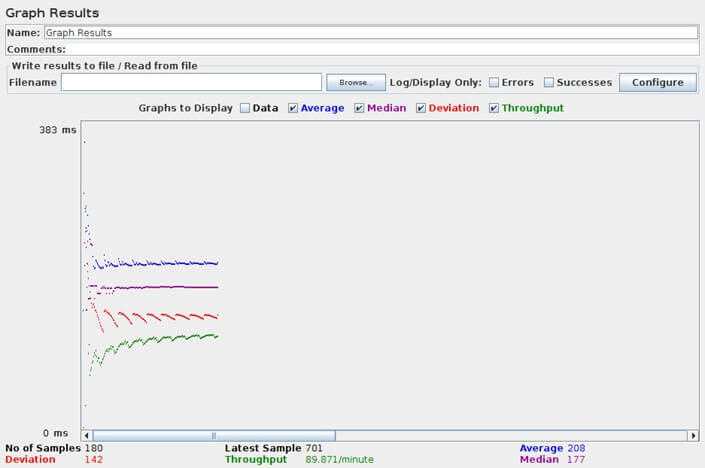
Graph result
In this we can view the result in the form of a graph. Here is an example:
I hope my blog has helped you get better acquainted with JMeter and its components. Write to us at Nitor Infotech with your feedback or if you would like to know more about our quality engineering experts’ agile approach that contributes to maximum business growth.