Supercharging Application Performance Testing with k6’s capability
In today’s digital landscape, delivering high application performance is crucial for businesses to provide exceptional user experiences. Application performance directly impacts – user satisfaction, productivity, and the overall success of businesses. Here, performance testing plays a vital role in ensuring that applications can – handle heavy loads, perform optimally under stress, and meet user expectations. And k6 stands out as a potent and adaptable solution among the array of available software performance testing tools.
You might be wondering, about the conception of k6, right?
Well, in this blog post, let us explore k6 and its features. Later, we’ll dive into some examples of using k6 for performance testing.
So, let’s head on!
What is k6?
k6 is an open-source, developer-centric, load-testing tool designed for testing the performance of an application or a website. Its design prioritizes three things – usability, extensibility, and scalability. It empowers both QA (Quality Assurance) and development teams to:
- conduct rigorous tests
- replicate real-world load scenarios
- gather valuable performance metrics.
So, whether you want to test the response time of your website during a sudden traffic spike or evaluate the performance of your API under heavy load, K6 will back you up.
What does k6 bring to the table? Let’s get to know in the upcoming section.
Key Features of k6
Here are the features you can enjoy with k6 on your side:

1. Simple JavaScript Syntax: k6 uses the widely used JavaScript language, making it usable by developers of all levels. JavaScript enables the writing of test scenarios. Thus, making the design and customization of tests simple.
2. Realistic Load Generation: With k6, you can simulate real-life scenarios by generating concurrent virtual users, also known as “VUs”. Each VU runs in its own JavaScript context, allowing realistic test scenarios, data manipulation, and interaction with the tested system.
3. Performance Metrics and Visualization: k6 provides an extensive array of performance metrics, which includes:
- response times
- throughput
- error rates
- latency
These metrics are collected during test execution and can be exported in various formats for further analysis. k6 integrates with popular monitoring tools, such as Grafana enabling real-time visualization and analysis of performance data.
4. Command-Line Interface (CLI): k6’s CLI simplifies the process of executing tests. That is, it offers a user-friendly and efficient way to run performance tests from the command line.
To harness the full potential of these features, you can follow my guidance on conducting performance testing with k6.
Write Your First Performance Test Using k6
Here’s a step-by-step guide to performance testing using k6:
1. Installing k6: For this tutorial, we will be following the macOS installation guide. You can use homebrew and execute this command – Brew install k6
This is the only command we need to get started with k6.
2. HTTP get request: The next step is to write an HTTP request, and this is how you can do it:
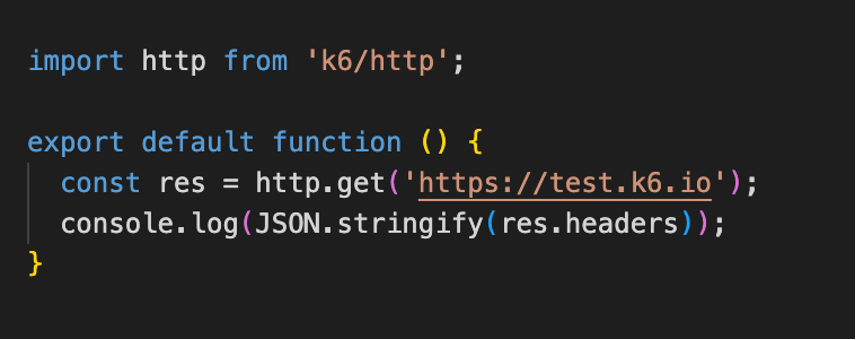
It then simply accepts a URL and generates a response.
3. HTTP post request: This is often used to simulate actions like submitting forms, sending data to a server, or creating resources, and k6 allows you to include such requests as part of your testing scenarios. Here’s the method to accomplish it:
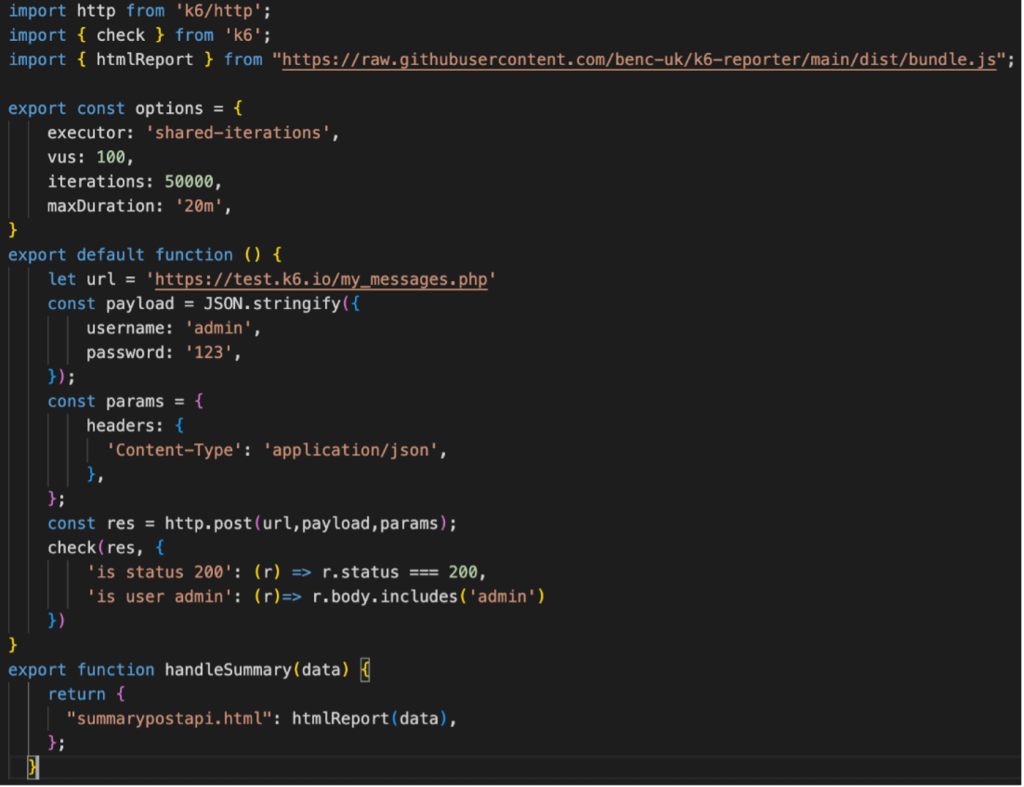
In the script above, we have utilized the URL, request body, and supplementary request parameters. We’ve also validated the status code and response. Additionally, the ‘params’ constant is employed to verify extra parameters in the POST request. Furthermore, the ‘options’ play a pivotal role in configuring the behavior of the test run.
For instance, options encompass defining test tags, setting thresholds, specifying user agents, and determining the number of virtual users and iterations.
The script option object contains these –
- executor: ’shared-iteration’ (executor shares iterations between the number of VUs. The test concludes when k6 completes all iterations.)
Executors control how k6 schedules VUs and iterations. Define the executor in the executor key of the options object. The value comprises the executor’s name, separated by hyphens.) - vus: 100 (No of virtual users used)
- iterations: 50000 (No of iterations performed by each vu)
- maxDuration: graceful-stop of execution
- p(N): specifies the threshold percentile value, expressed as a number between 0.0 and 100. For example, p (99.99) means the 99.99th percentile.
4. Using k6 browser: This introduces browser automation and end-to-end capabilities of k6, bolstering its core functionality and making it a comprehensive platform for testing websites. It supplements your k6 tests with browser-level APIs, enabling interaction with browsers and the collection of frontend performance metrics.
Did you know? – This module also supports Playwright API.

Follow the given steps:
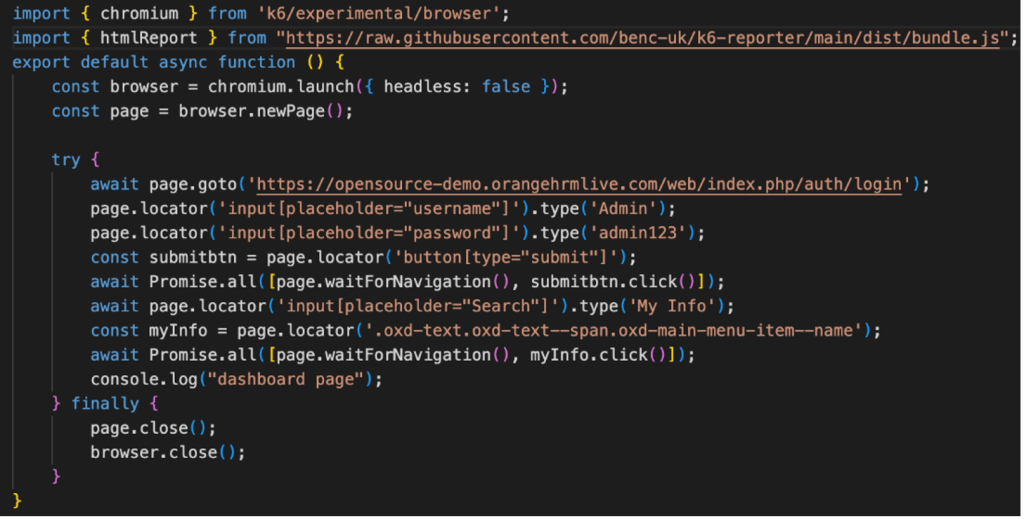
- The below given code launches a Chromium-based browser, visits the application, and mimics a user logging in to the application.
- It then searches ‘My Info’ section and navigate on that page. The browser has parameters-headless with the value false which enable user to see browser launching.
- Interact with elements using page.locator() by passing in the element locator. This will create & return a locator object which you can interact with.
- There are many asynchronous browser operations to be handled. To handle timing error and other race conditions, you must ensure that you want it to finish. The promises must be handled carefully.
- In the above-mentioned code the page.goto(), element.click() and page.waitForNavigation() methods should return a promise and Promises.all() method is used to wait for the promises to be resolved.
Next up, you need to run the below code in VS code.
Further, run the test on your terminal with command:
K6_BROWSER_ENABLED=true k6 run filename.js
After the test concludes, you will receive the following metrics:
- In a single script, you’ll not only receive the standard HTTP-specific metrics collected by k6 but also gain insight into browser performance, offering a comprehensive view of your application’s behavior from both the frontend and backend.
- The performance results from the browser module are derived from Core Web Vitals, which Google introduced as a unified set of metrics to evaluate the user experience on the web.
- When testing web applications, you will receive three crucial metrics that enhance user experience:
- loading testing
- interactivity
- visual stability
- As observed in the code above, after each web vital metric, an additional row with the same metric name is printed, accompanied by its rating. These ratings can be categorized as ‘good,’ ‘needs improvement,’ or ‘poor.’
- Furthermore, you have the flexibility to integrate both API-level and browser-level tests within a scenario, fostering enhanced collaboration among your team members.

5. Visualize Results:
k6 does not provide built-in pre generated reports. However, we can use third-party tools like – HTML report and xk6-dashboard.
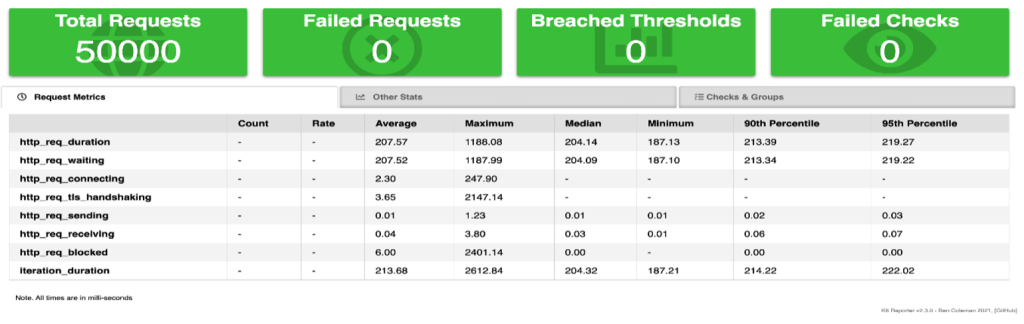
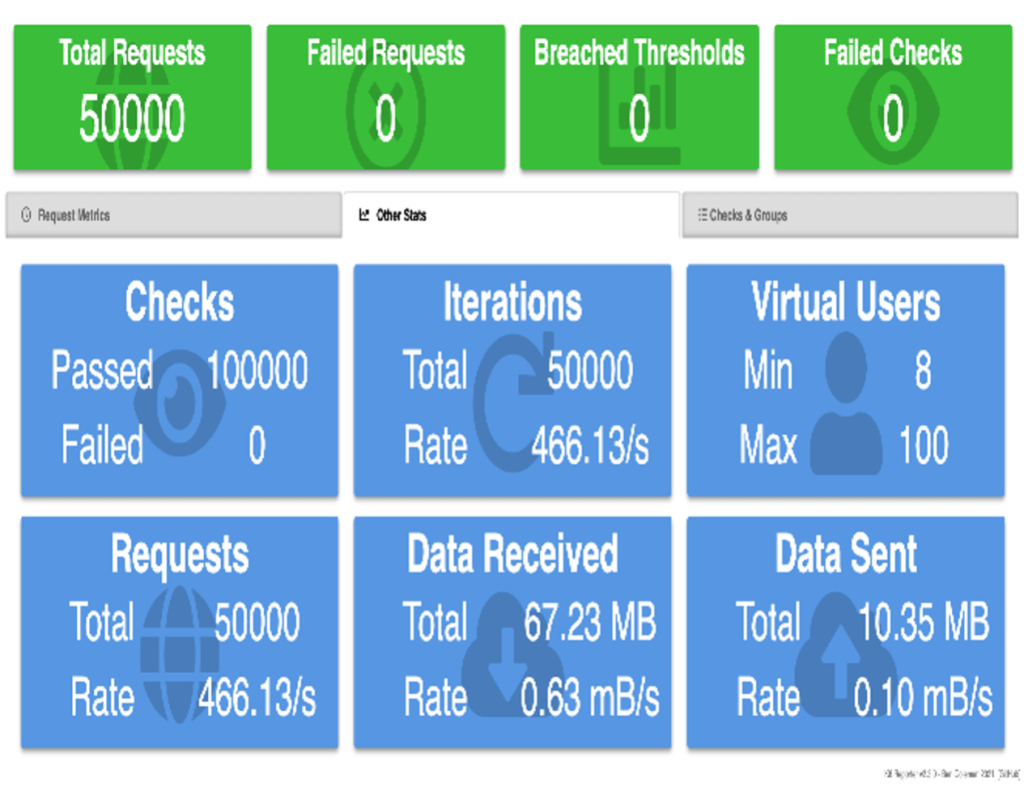
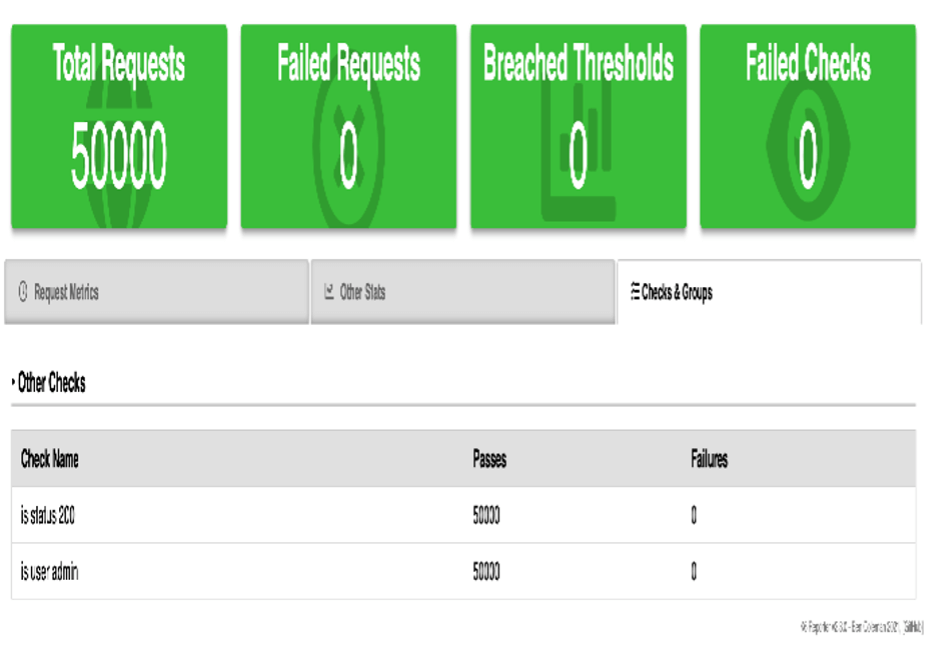
a. HTML Report
In addition to the default K6 format, you have the option to export the results in various other formats, including Custom summary, CSV, and JSON. Let’s explore the Custom summary format, which can be achieved using the ‘handleSummary()’ method. k6 automatically invokes this method at the conclusion of the test lifecycle, and it typically returns data in JSON format by default.
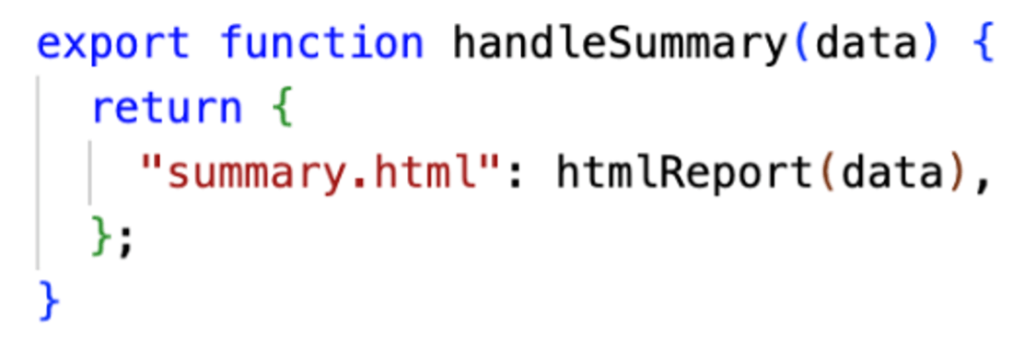
The custom output can be converted into html report by following just these 2 steps-
-
- Import the htmlReport function from the bundled module hosted remotely on GitHub-import { htmlReport } from “https://raw.githubusercontent.com/benc-uk/k6-reporter/main/dist/bundle.js”;
- Then outside the test’s default function, return it with the handleSummary(data) function which k6 calls at the end of any test, as follows:
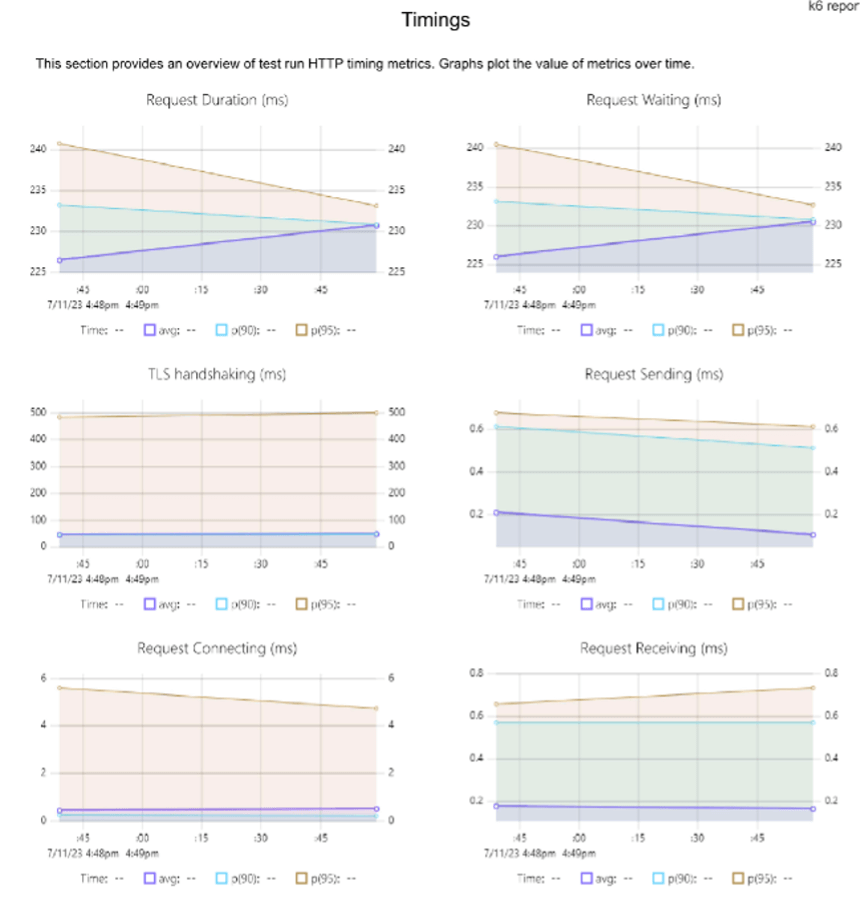
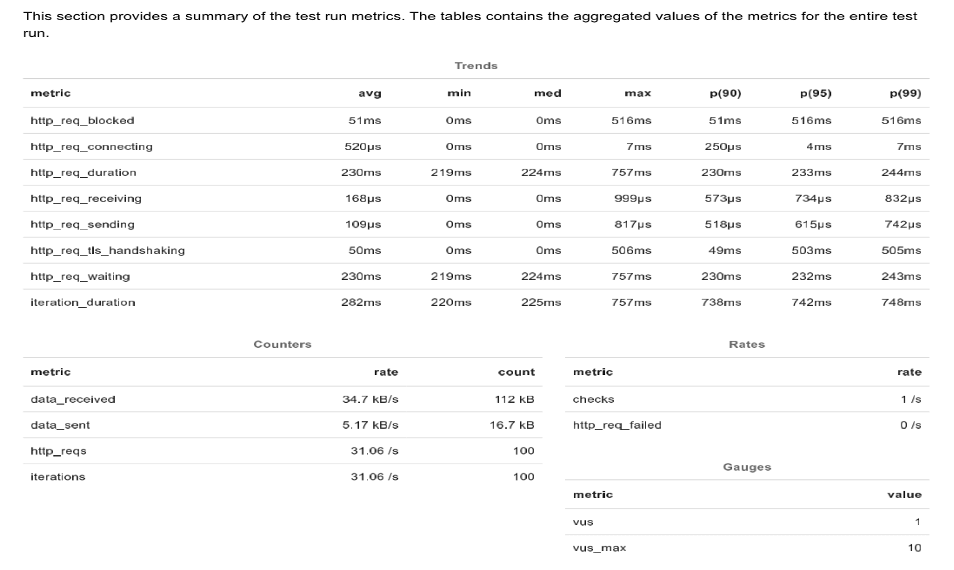
Here are a few HTML report screenshots for your reference –
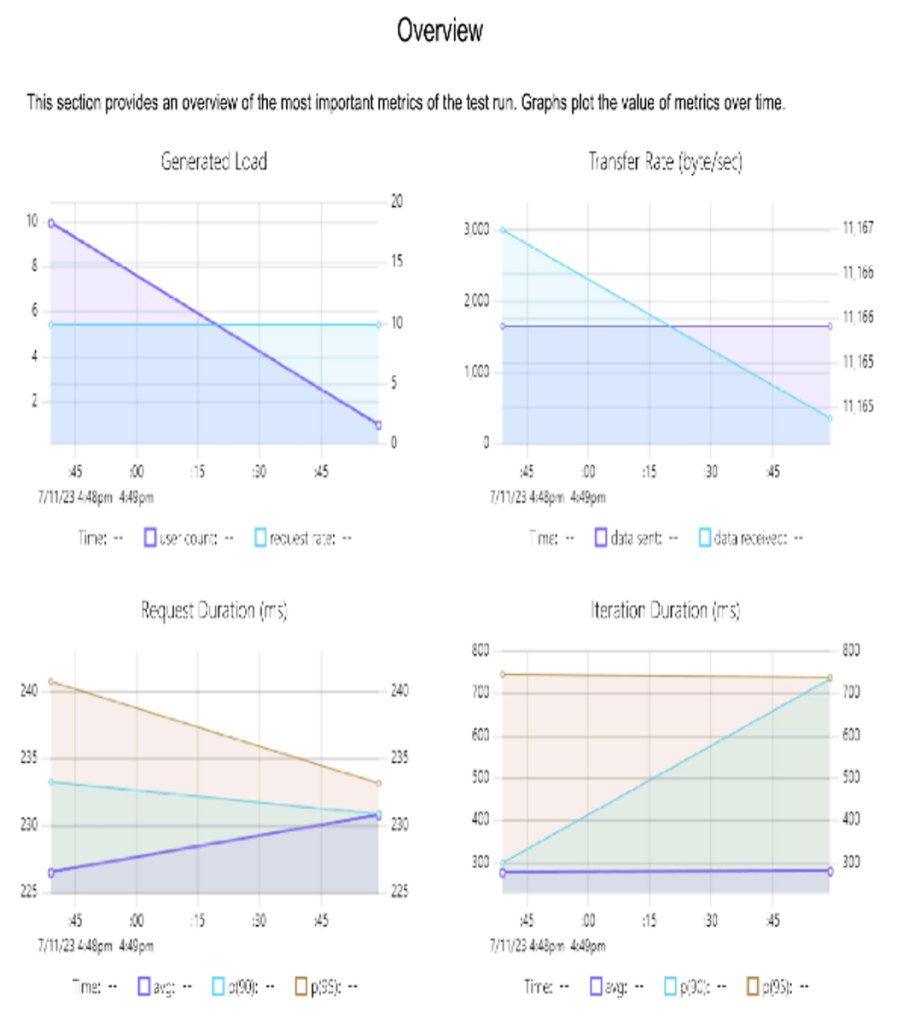
b. xk6-dashboard
A community effort called “xk6-dashboard” can be used to visualize the results mentioned above. A local web server that is run by the dashboard displays metrics as the test is being conducted.
The steps that must be performed are listed below:
1. Install latest version of Go language and Git
2. Download xk6 using command-
go install go.k6.io/xk6/cmd/xk6@latest
3. Build the binary using command-
xk6 build --with github.com/szkiba/xk6-dashboard@latest
4. Run the test with the custom binary, using dashboard as the argument for –out.
./k6 run --out dashboard script.js
5. Visit the dashboard on your localhost and view results as they appear.
The default is it set at http://127.0.0.1:5665/
Here are a few xk6-dashboard screenshots –
Keep reading as we quickly compare of k6 with JMeter.
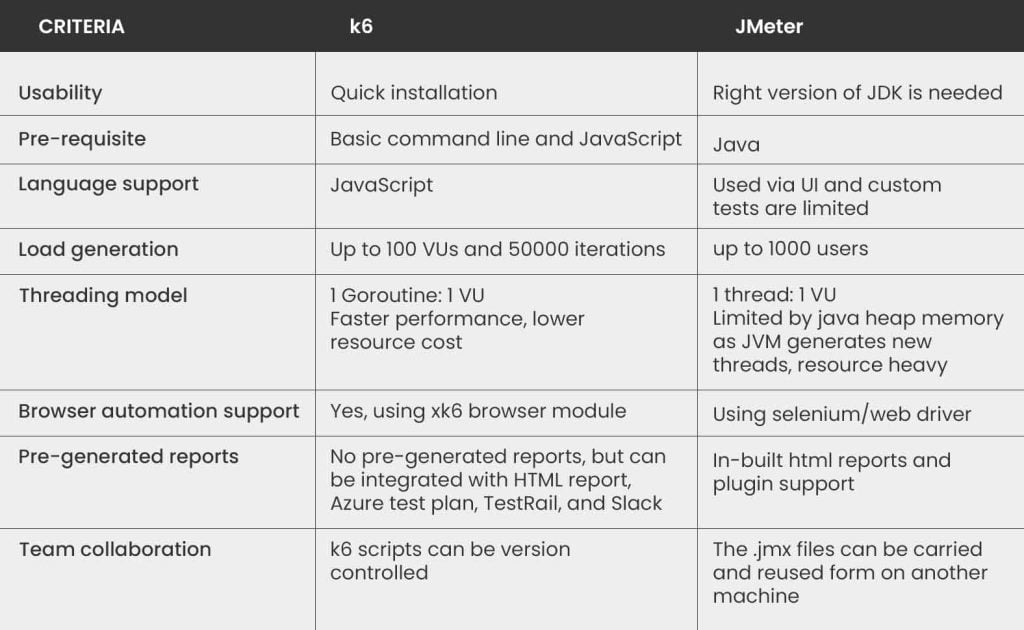
k6 Versus JMeter
The choice of a performance testing tool depends on your specific application requirements. For instance, if you prefer a user-friendly tool with extensive community support, JMeter might be your best fit. On the other hand, if you are proficient in JavaScript and require a highly customizable testing framework, k6 should be your preferred choice.
The below table shows comparison of k6 and JMeter:
So, in a nutshell, k6 is an effective and simple performance testing solution that enables developers and QA teams to guarantee the best app performance. It gives businesses the ability to spot performance bottlenecks early in the development lifecycle and address them. Businesses can create successful, high-performing applications by utilizing its dynamic capabilities.
Also, get in touch with Nitor Infotech to enhance your performance testing strategy with cutting-edge tools and technology!