GeoServer is an open-source server that facilitates the sharing, processing and editing of geospatial data. When we are dealing with a large set of geospatial data, we generally use WMS service to get the image of the features at lower zoom level. This reduces the load on browser to render millions of data. Then after a certain zoom level, we use WFS service to fetch the features and attributes that can be used to plot the geospatial data on the map.
When WMS service is called, GeoServer uses the SQL query, defined in the layer, and fetches the data from the database. This data is converted into an image tile by GeoServer and then it is sent as a response to the client. In WFS service, data is fetched using the same SQL query and then transformed into an object of features with projection metadata.
With the increase in the set of data, the processing time of GeoServer also increases to transform the data into an object or a buffer image. On the client side, Leaflet also takes time to render each feature (geospatial points) on the map. Along with this, when the map is moved or any zoom operations performed on it, the entire process is repeated.
To tackle this, vector grids were used. A vector grid calls GeoServer to get the object of features only one time. Then it caches all the grids generated for the map. This reduces the processing time when the map is moved or zoomed. Then again, as the data increases, the cache storage starts affecting the performance of the browser.
This is what we faced when we tried to render a layer with 5.4 million data. When zoomed out to the max, the vector grid tried to process and cache 5.4 million data. This process was taking a heavy toll on the browser, forcing it to crash. This limitation forced us to render the layer only at zoom level of 10 miles and not rendering above 10 miles.
For the zoom level above 10 miles, we tried to render image tiles using GeoServer. But when we tried calling the WMS service to fetch a buffer image of 5.4 million data, it took around 2-3 minutes to get fully rendered buffer images, which is not an efficient response time for a WMS request.
Now, what is the solution to this problem?
Solution: ArcGIS Online
ArcGIS Online is the tool which can be used to tackle this problem. ArcGIS Online is a cloud-based mapping and analysis solution, which is used to make maps, analyze data and to share and collaborate. We are going to use the data sharing feature of ArcGIS Online.
ArcGIS Online allows us to create hosted image tile layers using hosted feature layer. It creates pre-built image tiles at different zoom levels using the data in the hosted feature layer.
Here, image tiles are built at the time of layer creation and then all the tiles are hosted on imagine service. Whenever a request is sent, ArcGIS Online will fetch the pre-built image tile for the current level and sends it for the client to render.
How does it solve the problem?
Right now, whenever a user tries to toggle the layer with 5.4 million data, it doesn’t show anything on the map if the zoom level is above 10 miles. The user must zoom to 10 miles or lower to start rendering the data. This was done to reduce the load on browser when vector grid starts caching the tiles. And if we use the image tiles of GeoServer, it was taking around 2-3 minutes to transform fetched data from database to image tiles.
Image tiles in ArcGIS are prebuilt tiles, which means the transformation of data to image tiles is already done by the ArcGIS server at the time of layer creation. Using ArcGIS image tiles, the layer network call will quickly fetch all the pre-built tiles and render them. This process takes around 3-5 seconds.
How to use hosted image tile layer service?
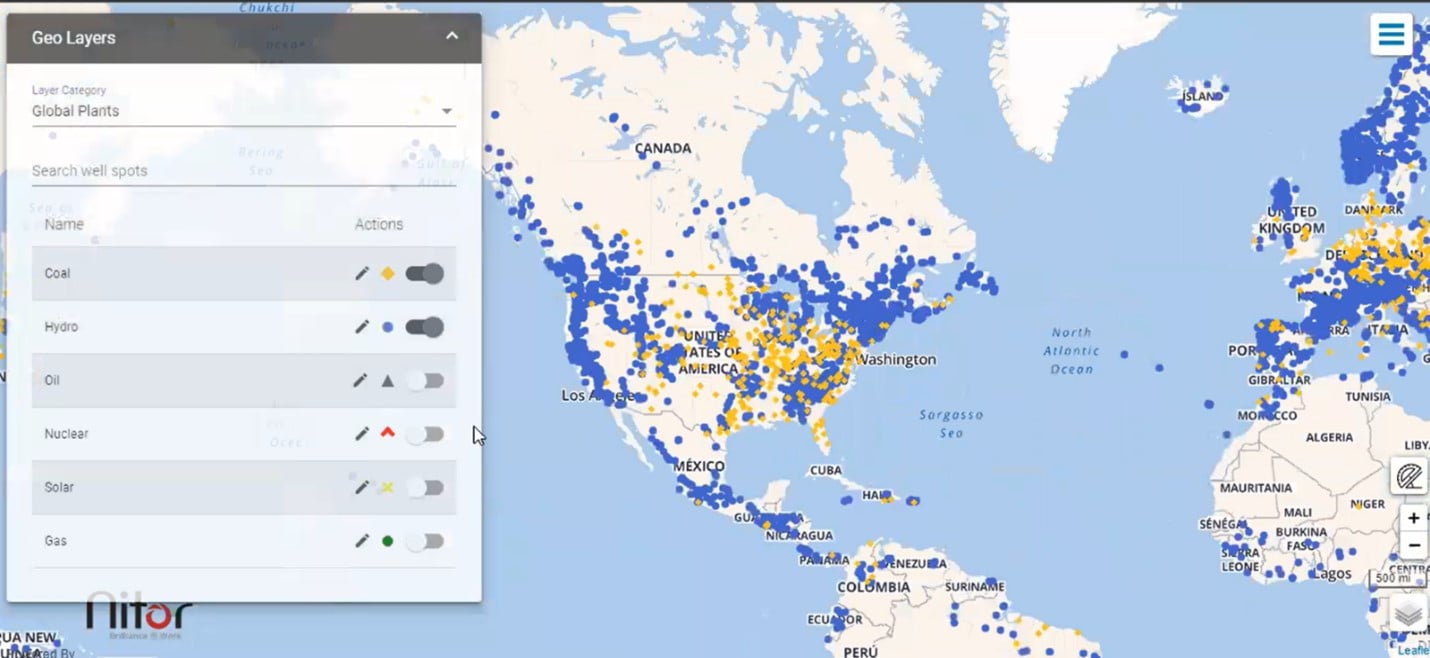
Here, we’ll take an example of Global Plant plotting using latitude and longitude.
1. Create one .csv file containing the latitude and longitude of each Global Plant.
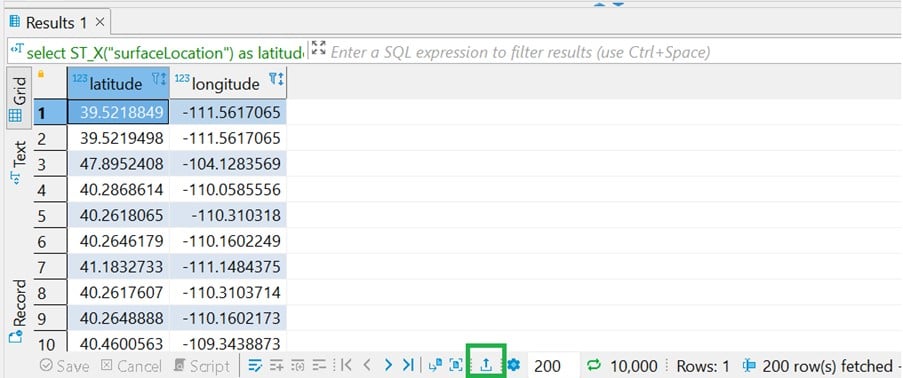
In the case of Postgres, using the following query to generate the data for export
select ST_X("surfaceLocation") as latitude, ST_Y("surfaceLocation") as longitude from production_well_informations
Here ”surfaceLocation” is a geometry column containing latitude and longitude.
Once data is generated, click on the export icon at the bottom of the generated data and export it as a .csv file.
2. Sign in to your ArcGIS organizational account.
3. On the ribbon, click Content.

4. Click, New Item.

5. Drag your downloaded .csv file from your computer into the New Item window and then update the details.
6. Make sure that Add .csv file and create a hosted feature layer or table option selected and then click Next.
7. On the Fields page, leave all the fields on and click Next.
8. On the Location settings page, select the columns which represent Latitude and Longitude and click Next.
9. In the New Item page, fill all fields as per requirement and then click Save.
10. Wait for the feature to get published and you’ll be redirected to Feature Overview page.
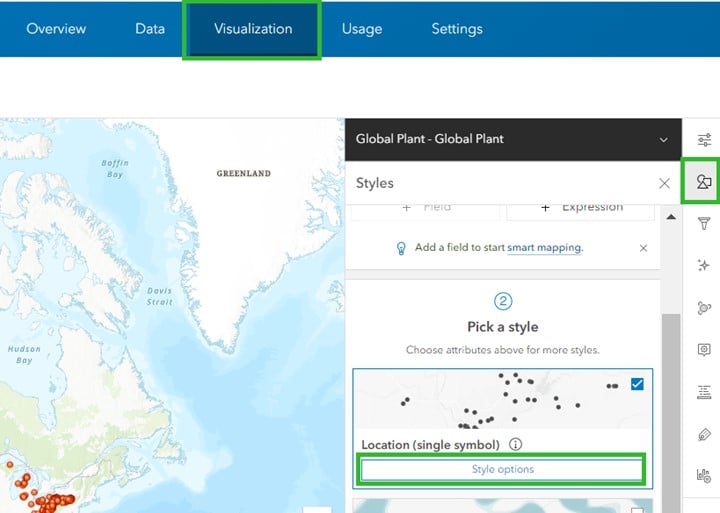
11. Click on the Visualization tab and change the style of the symbols as per your requirement. This is required because the image layer that is created by feature layer uses the style options of feature layer. Later you cannot change the style of your image tiles.
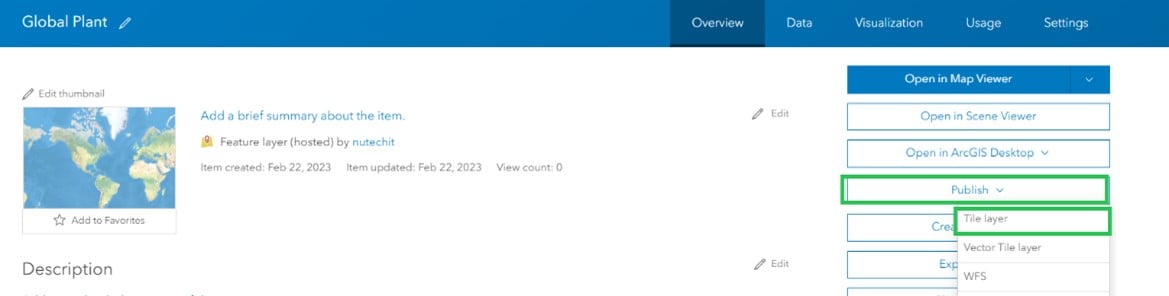
12. On the Feature Overview page, on the right of the screen, click on Publish, and then click on Tile Layer. This will start the process of creating image layer using feature layer.
13. In Create a tile layer page, leave all the fields as they are and click on Next.
14. Then fill in the required details like, tile, Folder, Tags and Summary and click on Save.
15. Wait for the image layer to get published and you’ll be redirected to Image layer overview page.
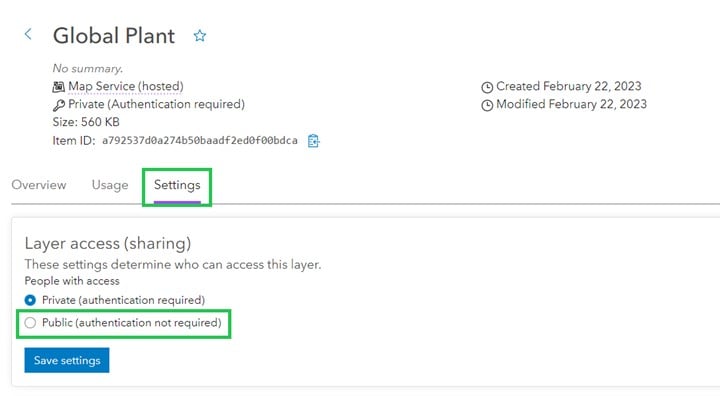
16. On the Image layer overview page, click on the Settings ribbon.
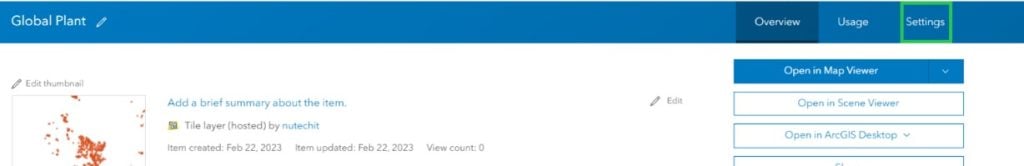
17. In the Settings page, scroll down to Tile Layer (hosted) section and adjust the Visible Range to make the image layers visible on those zoom range.
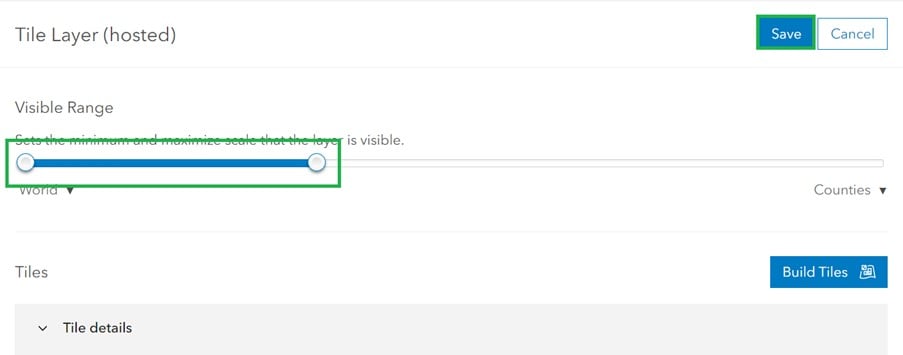
18. The image tiles should start getting built automatically and the process can be seen in the section Tile details. If it doesn’t start automatically, then click on Build Tiles to start the building process.
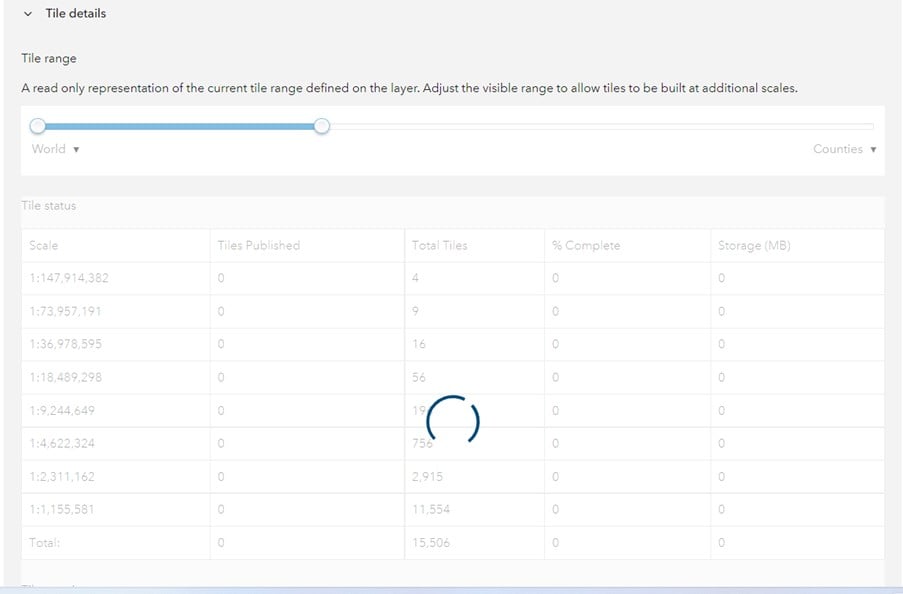
Here, all the image tiles will be built for various zoom levels.
19. Click on the Overview ribbon and copy the URL for this image service.

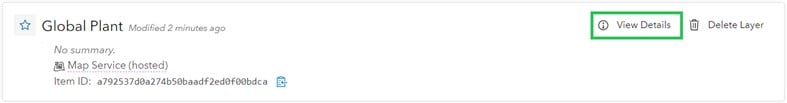
20. Sign in to the ArcGIS Developer Layer page.
21. Click on the View details option of the image that was created in the previous steps.
22. Click on Settings ribbon and change the Layer Access setting to Public and click on Save. Private option can also be used, in this case, API key is required while adding the layer via ERSI.
23. Paste the copied URL in the ESRI tiled map layer syntax.

This syntax will add the image layer on the map.
As you zoom into the map, new tiles will be fetched from the stack of pre-built tiles in ArcGIS Online.
Performance testing with Vector Grid
Following is the screenshot of Vector Grid API call timings, which fetches the vector grid data from GeoServer:
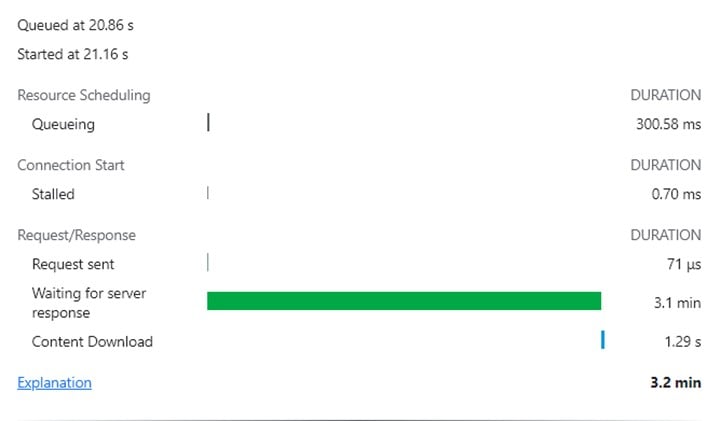
As you can see in the screenshot, it took around 3 minutes to complete the API call. It takes additional minutes to load the vector grid on the map, which in turn make the browser slower.
Performance testing with ArcGIS
Following is the screenshot of ArcGIS API call timings, which fetches the pre-rendered image grid data from ArcGIS:
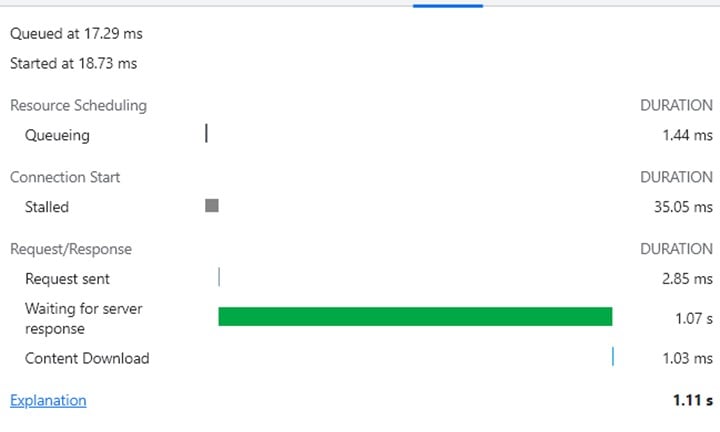
Minimum time taken by API to complete (for minimum number of image layers)
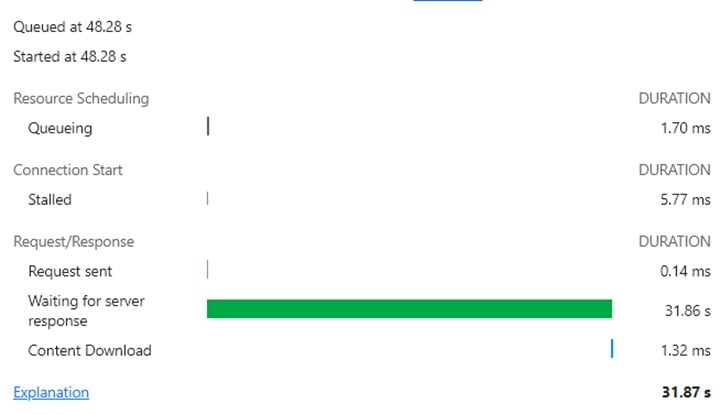
Maximum time taken by API to complete (for maximum number of image layers)
In both cases, the time to complete to API calls is 85% faster than Vector Grid API calls. With this efficiency, we can load large set of records as an image layer on a map. For interactive layers, we can load Vector Grid at a certain zoom level where the dataset is minimum.
Well, I trust you found this an insightful read! Send us an email with your thoughts about this blog. Visit us at Nitor Infotech to learn more about our big data technology expertise.