Highlights
This blog explores how Datadog is evolving from a traditional monitoring tool into an intelligent observability platform powered by AI. It explains how machine learning enhances anomaly detection, event correlation, and alert prioritization across distributed cloud environments. By unifying metrics, logs, and traces into a single view, Datadog enables teams to reduce noise, identify root causes faster, and operate more proactively.
Ideal for DevOps teams, cloud engineers, and technology leaders, this blog highlights how AI-driven observability supports smarter decisions and stronger operational resilience in modern digital systems.
Imagine this, a celebrity mentions a new show, and within minutes, everyone’s glued to the same show. Traffic jumps quickly, and the platform suddenly must handle far more users than usual.
Alerts begin firing in:
- CPU usage is high
- Memory is climbing
- Response time has increased
- Error rates are spiking in one region
The operations team stares at dashboards, and the questions begin:
- Why is the app slowing down if servers are running?
- Is this just high traffic, or is something actually broken?
- Which service is causing the delay?
- Did a recent code deployment trigger this?
- How do we find the root cause quickly?
- Can we predict if this will turn into a full outage?
Traditional monitoring tools can answer only the first layer. They show metrics. They display graphs. They send alerts.
But here’s the problem.
Modern applications aren’t single machines. They’re distributed ecosystems with microservices talking to other microservices, containers scaling dynamically, APIs connecting to third-party systems, all running across cloud environments.
One tiny configuration issue in one service can ripple across the entire platform.
So, here are the real questions:
- How do teams move from simply monitoring data to actually understanding it?
- How do they reduce alert noise and focus on what truly matters?
- How can AI help detect patterns humans might miss?
- What does “intelligent observability” really look like?
In today’s world of AI, businesses don’t just expect visibility; they want more. They need systems that can correlate signals, can detect anomalies, surface root cause, and guide action.
This is the shift from monitoring to intelligence. This is where AI observability begins to matter.
This is where platforms like Datadog AI step in.
Let’s begin with understanding what Datadog is.
What is Datadog?
Datadog Platform is a powerful cloud-based monitoring and observability platform designed to give you complete visibility into your technology stack. From applications and servers to databases and cloud services, it tracks performance in real time, so you can spot issues instantly, uncover root causes faster, and keep your systems running at peak performance.
It brings together the data your systems are already producing, which consists of metrics, logs, and traces, and puts it into a single view. So rather than checking different tools to piece things together, teams can understand what’s going on from one platform.
Modern digital systems aren’t simple anymore. A single app can run across different cloud providers, containers, APIs, and dozens of microservices. So, when something slows down, figuring out where the problem has started isn’t always straightforward.
This is where Datadog becomes useful.
What does Datadog do?
At its core, Datadog helps teams see what’s really happening across their systems.
- Data Monitoring starts its job with collecting real-time data from servers, containers, databases, and cloud platforms.
- It then tracks application performance and user experience.
- Connects related events across the system to trace issues back to where the issues started.
- Helps in spotting unusual behavior or unexpected spikes that don’t look normal.
- Highlights important alerts instead of flooding teams with noise.
In simple terms, monitoring lets you know something has changed. Datadog helps you understand what has changed, why it happened, and what the next step should be.
What’s more, in a world powered by AI-driven systems, that kind of clarity isn’t optional; it’s critical.
What are the Features of Datadog?
Datadog delivers true end-to-end observability across your entire technology stack, from infrastructure and applications to security and user experience. With real-time monitoring, distributed tracing, AI-driven alerts, and seamless cloud integrations, it empowers teams to detect issues faster, resolve them smarter, and operate with confidence.
Systems rarely crash all at once. More often, they slow down a little, throw a few odd errors, or behave differently than usual. When it finally becomes a real issue, figuring out where it began can take time. What makes Datadog useful is how it connects those scattered signals and helps teams make sense of them.
So, what actually enables that move from basic monitoring to something more intelligent?
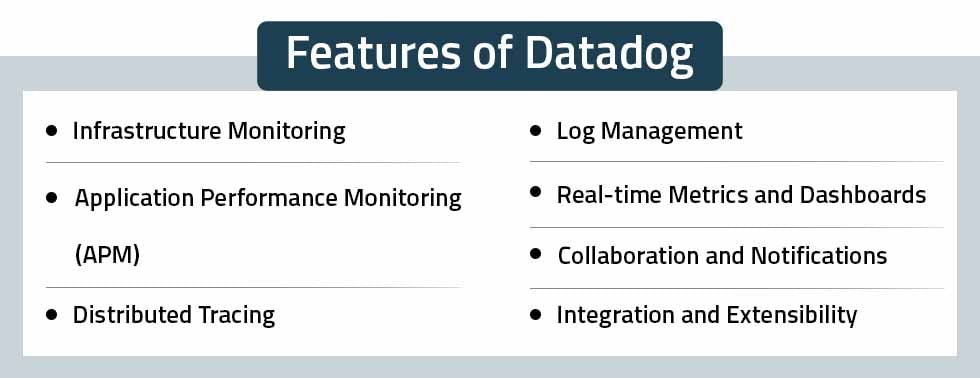
Fig 1: Features of Datadog
Infrastructure Monitoring
Infrastructure monitoring is basically the starting point. If the underlying systems aren’t healthy, nothing else really works. Datadog delivers comprehensive Cloud Monitoring across servers of what’s going on across your servers, containers, networks, and cloud services as they run. It tracks everyday system stats like CPU, memory, disk, network across whatever environment you’re running. If something seems off, teams can catch it before it turns into a bigger issue.
Application Performance Monitoring (APM)
APM focuses on how the app behaves in real use. It monitors response times and errors, so teams can tell when performance begins to slip. More importantly, it connects those slowdowns back to what’s happening behind the scenes. So, teams aren’t just staring at system metrics; they can see how performance is affecting users.
Distributed Tracing
In a microservices setup, one request can pass through several services before it finishes. Distributed tracing tracks that path. It shows where delays happened and how the services are connected. So instead of guessing what caused the issue, teams can see the sequence and figure it out quickly.
Log Management
On their own, logs are just lines of text that don’t tell you much at first glance. Hard to scan. Harder to connect. Datadog puts them in one place and ties them to the related metrics and traces, so teams can see what happened without digging through pages of raw entries.
AI-Based Anomaly Detection
Modern cloud-native systems produce an endless stream of metrics, logs, and traces. On that scale, manual monitoring just doesn’t cut it. Static thresholds also fall short when environments are constantly changing. Through AI monitoring, Datadog uses machine learning to pick up on patterns that seem out of the ordinary. It reduces unnecessary alerts and surfaces potential issues earlier, giving teams time to act before things get worse.
Unified Observability
With Datadog observability, teams don’t have to switch between different tools to understand what’s happening. With Datadog, everything sits in one place. Metrics, logs, traces, and eventsare visible together. That makes it easier to understand the system without stitching information from multiple dashboards. This creates true observability intelligence across the stack.
Cloud & Integration Ecosystem
Datadog works with major cloud platforms and a wide mix of third-party tools, so teams don’t have to rethink their setup. It fits into multi-cloud and cloud-native environments and connects with DevOps, security, and collaboration tools. As the infrastructure evolves, it continues to function the same way, so visibility doesn’t drop off.
Put simply, Datadog isn’t just gathering data. It helps connect what’s happening across the system so teams can understand it without digging through everything themselves. Instead of only watching numbers, teams can better judge what realistically needs attention and what doesn’t.
What Are the Key Features of Datadog AI for Intelligent Monitoring?
- Real-time cloud monitoring of servers, applications, and system metrics
- Customizable dashboards that deliver actionable Datadog insights
- Automated alerting based on defined thresholds and predictive monitoring signals
- Support for over 250 integrations across tools and services
- Compatibility with major languages including Java, .NET, Python, PHP, Go, Node, and Ruby

Discover how we help organizations streamline releases, reduce risks, and build a culture of continuous improvements. See what intelligent DevOps transformation looks like.
Here’s the Datadog architecture diagram:
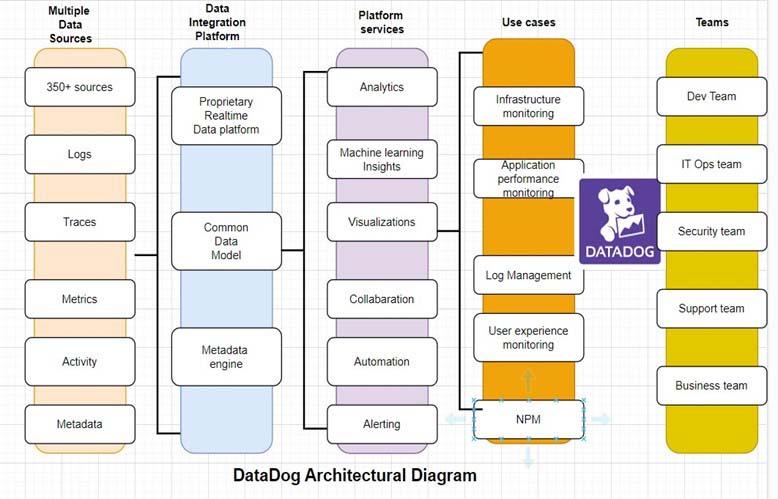
Fig 2: Datadog architectural diagram
How Does Datadog Use AI to Move from Monitoring to Intelligence?
Datadog AI transforms traditional monitoring into intelligent operations by applying advanced AI Analytics and machine learning to analyze observability data, detect patterns, correlate events, prioritize alerts, and provide contextual insights. This enables organizations to move from reactive issue detection to proactive system optimization.
Here’s how AI adoption actually changes things inside Datadog:
- With dynamic baseline creation, the system learns what normal looks like over time instead of depending on fixed thresholds. Alerts shift as traffic and usage change.
- Through anomaly detection, it notices unusual behavior in metrics, logs, and traces small signals that might otherwise go unnoticed.
- Using event correlation, related signals across infrastructure and applications are connected, so alerts don’t appear in isolation.
- With alert prioritization, not every notification is treated equally. The focus stays on things that truly need attention.
- With root cause identification, the system looks at patterns in the data to figure out where a slowdown or failure probably started.
- Predictive insights work a bit differently. This approach supports predictive monitoring, where risks are identified early, they highlight risks early sometimes before anyone notices there’s an issue.
In essence, AI shifts observability from data display to data interpretation.
Monitoring gathers signals.
AI transforms those signals into actionable intelligence.
That transformation defines operational resilience in the age of distributed, cloud-native systems.
This shift builds real operational intelligence in modern cloud-native environments.
Now it’s time for the bonus of this blog! Let’s delve into a case study.
Case study: Enhancing application performance and infrastructure with Datadog
An e-commerce or banking services organization experienced high traffic and required robust monitoring solutions. This was to ensure optimal performance, reliability, and scalability.
Challenges:
Some of the challenges were:
Lack of comprehensive visibility: The existing monitoring tools that they already used provided limited visibility into their complex microservices architecture. So, it was very difficult to identify issues and RCA for that.
Inefficient troubleshooting: Application and infrastructure trouble shooting was a time-taking, manual process. Its effects included some downtime and customer dissatisfaction.
Scalability concerns: Every organization’s goal is to expand their customer base and infrastructure. Their existing monitoring solution struggled to handle the increased scale and complexity.
Here are some solutions for these challenges, powered by Datadog:
APM [Application performance monitoring]: Datadog APM offered deep insights into their application performance. By instrumenting their microservices, they gained visibility into individual service response times, error rates, and latency. There was detailed monitoring of the resource utilizations and improving the overall user experience. This enables deeper performance intelligence across applications.
Infrastructure monitoring: It enabled the organization to monitor the entire infrastructure stack. This included servers, containers, databases, and cloud services. It set up custom dashboards and alerts for tracking metrics like:
- CPU usage
- Memory utilization
- Network traffic
- Disk I/O
This proactive monitoring helped them to identify and resolve potential issues before they impacted the end-user experience.
Log management: This provided a centralized and powerful solution for collecting, processing, analyzing, and visualizing logs from various resources. It centralized logs onto a single platform, enabling efficient log searching and filtering. It helped the organization to:
- Gain insights into their application and infrastructure logs
- Identify issues
- Improve troubleshooting, monitoring capabilities and faster RCA
Well, as you have scrolled till the very end of the blog, you must be well acquainted with Datadog. It is worth continuing the exploration of how it plays an important role in AI observability. Watch this space for more blogs revolving around related technologies!
Contact us at Nitor Infotech to share your views about this blog.