What is Microsoft Fabric?
Microsoft Fabric is an end-to-end, unified analytics platform. It’s designed to empower organizations to unlock the full potential of their data. Talk about paving the way for AI-driven innovations!
Fabric is a complete analytics platform. It combines Azure Data Factory, Azure Synapse Analytics, and Microsoft Power BI into a unified solution.
With simplified development, deployment, and management, Fabric enables seamless extraction of insights from data. It also delivers a quick time-to-value through its SaaS approach. Let’s explore it in today’s blog!
For starters, here’s its architecture:
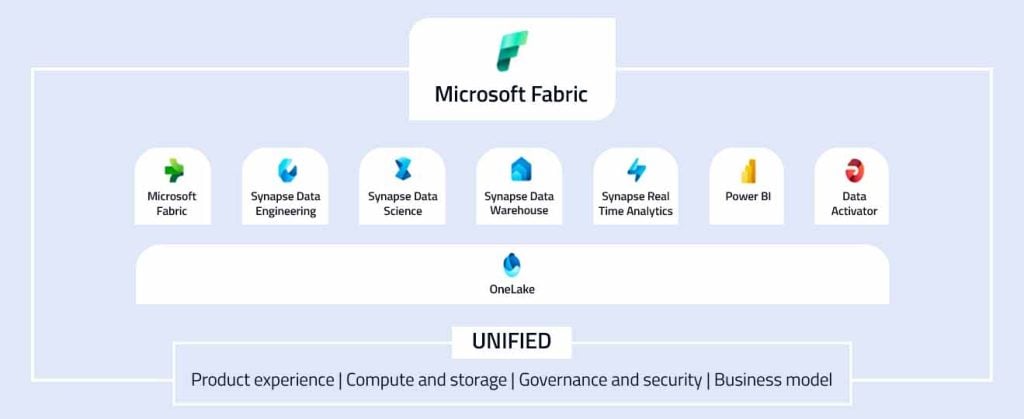
Fig 1: Microsoft Fabric Architecture
Take a look at its features:
Features of Microsoft Fabric
Lake-Centric and Open Approach:
Microsoft Fabric takes a lake-centric and open approach with OneLake, a centralized data hub. It supports open data formats such as Delta and Parquet. This allows for efficient data management, eliminates duplication, and promotes flexibility and interoperability across different workloads.
Powered by AI:
Fabric is an AI-powered analytics platform that integrates Azure OpenAI Service. It empowers developers with generative AI for data analysis, while enabling business users to discover insights with AI assistance. The upcoming Copilot feature offers a conversational language experience for tasks like dataflows, code generation, and result visualization. With a focus on data security and privacy, Fabric ensures compliance for organizations.
Empowering Every Business User:
Microsoft Fabric empowers every business user by seamlessly integrating with Microsoft 365 applications like Excel, Teams, PowerPoint, and SharePoint. It brings data insights into everyday workflows. This allows users to access and analyze data in OneLake directly from familiar tools. This integration promotes collaboration, productivity, and informed decision-making across the organization.
Cost Reduction through Unified Capacities:
Microsoft Fabric’s unified capacity model minimizes wastage of computing resources by pooling them across all workloads. This streamlined resource management maximizes utilization, reduces costs, and eliminates idle capacity. This results in cost savings for organizations. The unified approach enables frictionless commerce and a seamless user experience.
With complete analytics capabilities, a lake-centric and open approach, AI-driven features, business user empowerment, and cost reduction benefits, Fabric sets a new standard for integrated analytics platforms.
It paves the way for innovation, efficiency, and data-driven success in the era of digital transformation and AI-driven insights.
Now, let’s focus on a sample demonstration of an end-to-end analytics solution in Microsoft Fabric.
Sample Demonstration of an End-to-End Analytics Solution in Microsoft Fabric
In a demonstration of Microsoft Fabric, an end-to-end analytics solution is built using two CSV files (sales.csv and customer.csv) stored in an S3 bucket. The sales.csv file is seamlessly copied into the Fabric lakehouse using a pipeline’s copy data activity. For customer.csv, a shortcut is created to reference the same S3 bucket.
Data transformations are performed using a Spark notebook, and the resulting transformed data is loaded into tables within the lakehouse. Finally, a Power BI report is effortlessly created, leveraging the tables in Fabric for data visualization and analysis.
By using Fabric, the complexity typically associated with connecting standalone services is eliminated. Fabric’s integrated architecture removes the need for explicit connections between services, streamlining the solution’s overall complexity.
Additionally, Fabric’s OneLake lake-centric architecture ensures a unified and integrated environment, powered by the OneCopy component that prevents unnecessary data duplication.
With Fabric, data from various sources can be seamlessly combined and accessed without the need for moving or duplicating data across different regions and clouds. This simplifies data management and enhances overall efficiency.
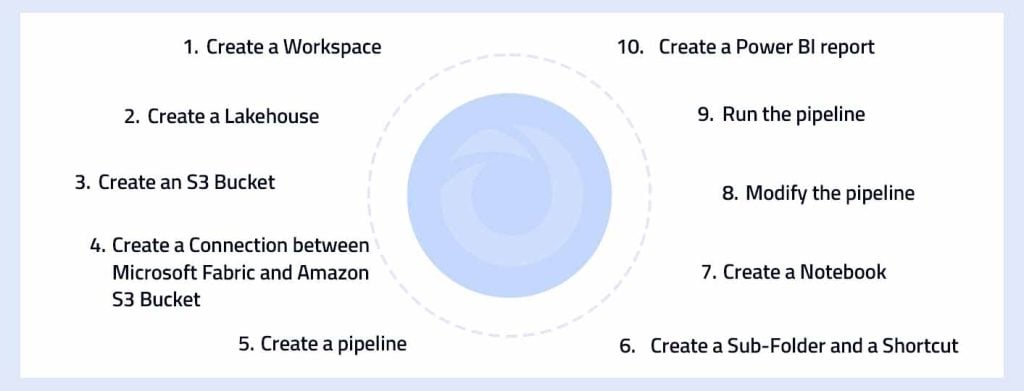
Fig 2: Building an end-to-end analytics solution within Microsoft Fabric
Step 1: Create a Workspace
- Go to the Microsoft Fabric website and log in using your credentials. Then, click on the Power BI option.
- On the left side of the menu bar, you’ll see an icon that looks like 🗇. Click on it to access the Workspaces section.
- Within the Workspaces section, click on the option to create a new workspace. Choose a name for your workspace and select a licensing mode that includes Fabric capacity, such as Trial, Premium, or Fabric.
- Once your new workspace is created, it will open, and you will see that it is currently empty.


Step 2: Create a Lakehouse
- After creating the workspace, you can switch to the Data Engineering experience and create a data lakehouse in the Fabric portal:
- To access the Data Engineering experience, navigate to the bottom left of the Power BI portal and click on the option to switch to it.
- The Data Engineering home page will be displayed, showing various tiles for creating commonly used data engineering assets.
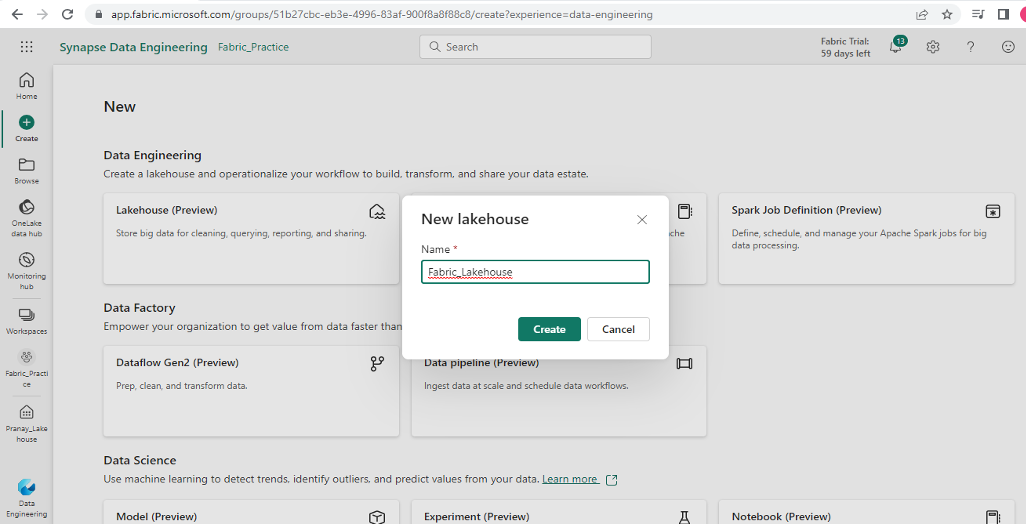
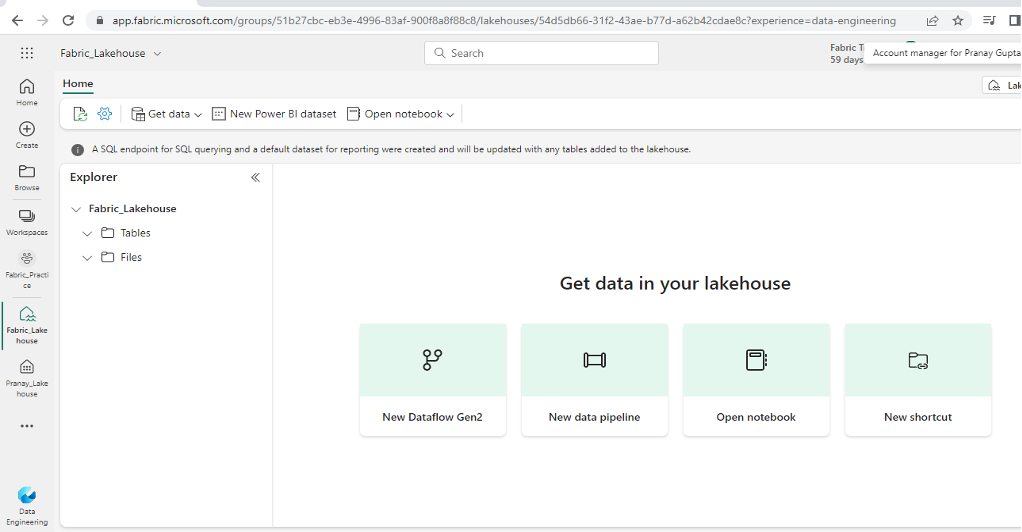
- In the Data Engineering home page, create a new Lakehouse by selecting the relevant tile and providing a name for your lakehouse.
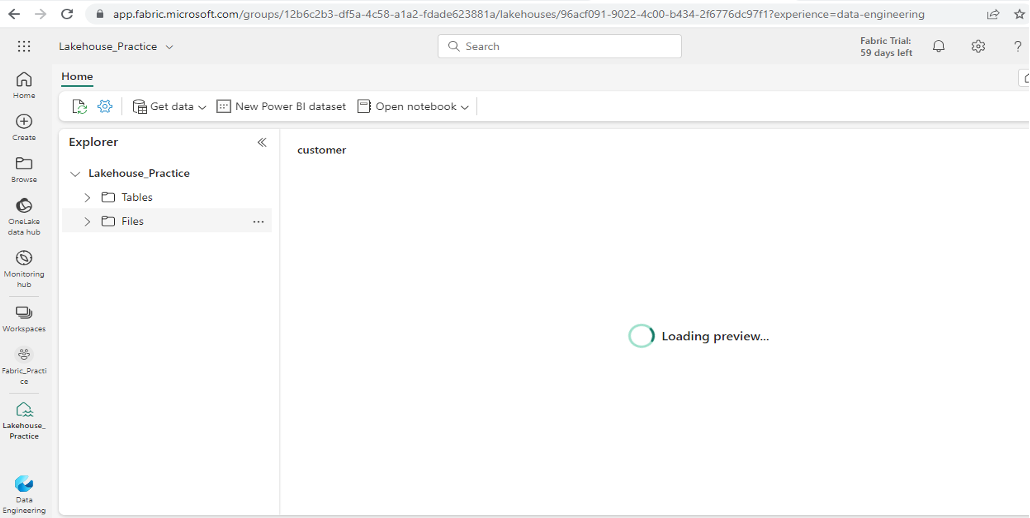
- After a short wait, the new lakehouse will be created. Take note of the Lakehouse explorer pane on the left side, which allows you to browse tables and files within the lakehouse.
- The Tables folder within the lakehouse contains tables that can be queried using SQL semantics. These tables are based on the open source Delta Lake file format, commonly used in Apache Spark.
- The Files folder in the lakehouse contains data files stored in the OneLake storage, which are not associated with managed delta tables. It’s also possible to create shortcuts in this folder to reference externally stored data.
- Currently, the lakehouse does not contain any tables or files.
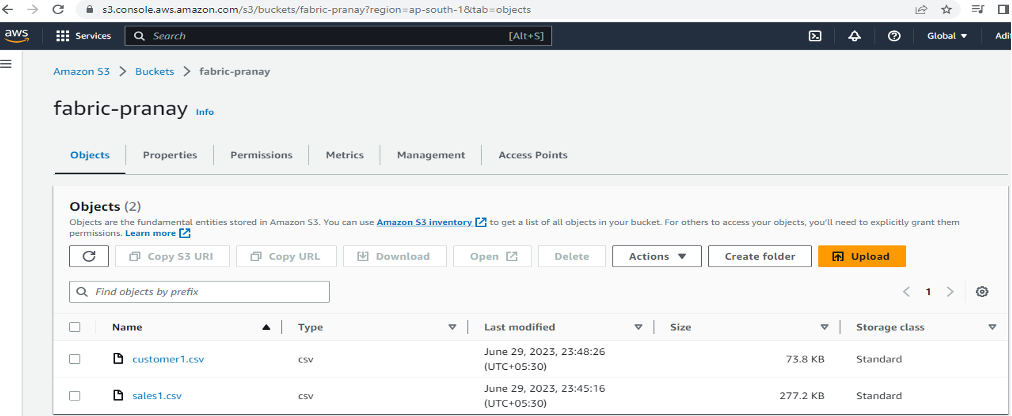
Step 3: Create an S3 Bucket
- Create an S3 bucket in the AWS service.
- Upload both the sales.csv and customer.csv files to the newly created S3 bucket.
- Make sure that you have been granted the required permissions for Amazon S3 object operations, specifically s3:GetObject and s3:GetObjectVersion.
- Additionally, ensure that you have the s3:ListAllMyBuckets and s3:ListBucket/s3:GetBucketLocation permissions, as they are necessary for operations such as testing connections and browsing from the root.
Step 4: Create a Connection between Microsoft Fabric and Amazon S3 Bucket
- In the Data Factory service, click on the page header and navigate to Settings > Manage connections and gateways.
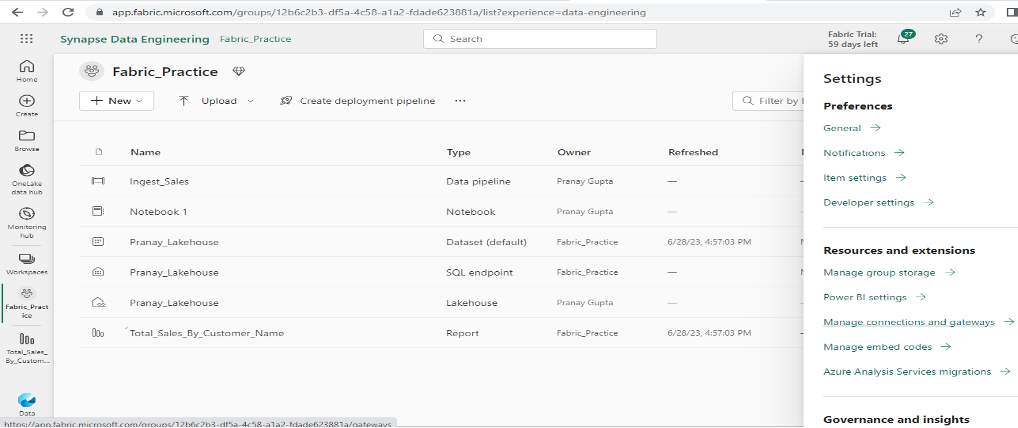
- Once in the Manage connections and gateways section, click on the “New Connection” button.
- A new tab will open where you can enter the necessary details to establish a connection with your S3 Bucket.

Step 5: Create a pipeline
- To ingest data into your lakehouse, you can use a Copy Data activity within a data pipeline. Start by navigating to the Home page of your lakehouse.
- On the Home page, select “New data pipeline” to create a new data pipeline specifically for ingesting sales data.
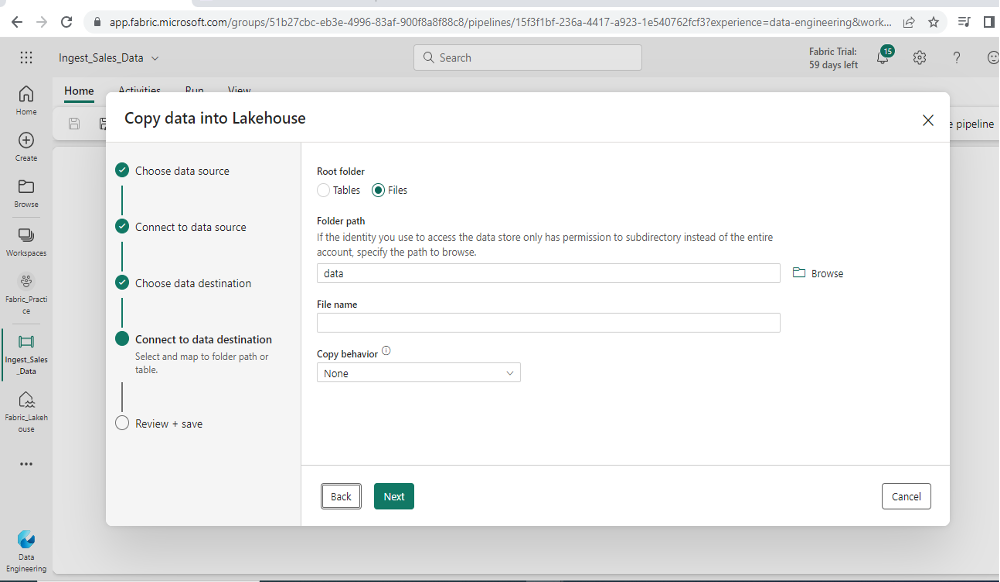
- If the Copy Data wizard doesn’t open automatically, go to the pipeline editor page and select “Copy Data” to open the wizard.
- In the Copy Data wizard, on the “Choose a data source” page, locate the “data sources” section, and select “Amazon S3” as the source.
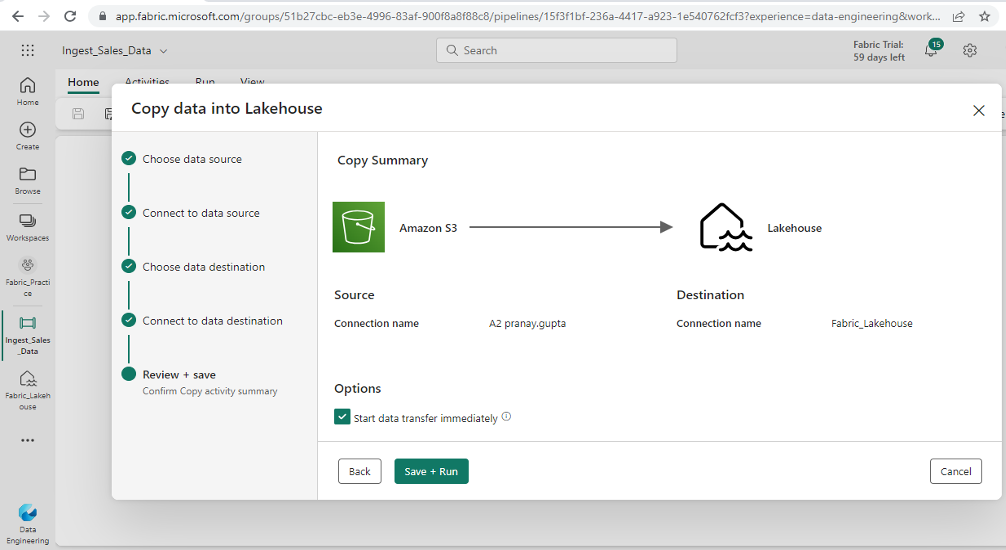
- Fill out the appropriate connection details for Amazon S3 and specify the source file (sales.csv) that you want to ingest.
- Provide the necessary destination details to specify your lakehouse as the target location where the data will be copied.

Step 6: Create a Sub-Folder and a Shortcut
- Open your workspace in the data engineering view and select your lakehouse. On the left side pane, you will see two folders named Tables and Files.
- Inside the Files folder, create a sub-folder named “data”. This is where the sales.csv file will be uploaded when you run the pipeline.
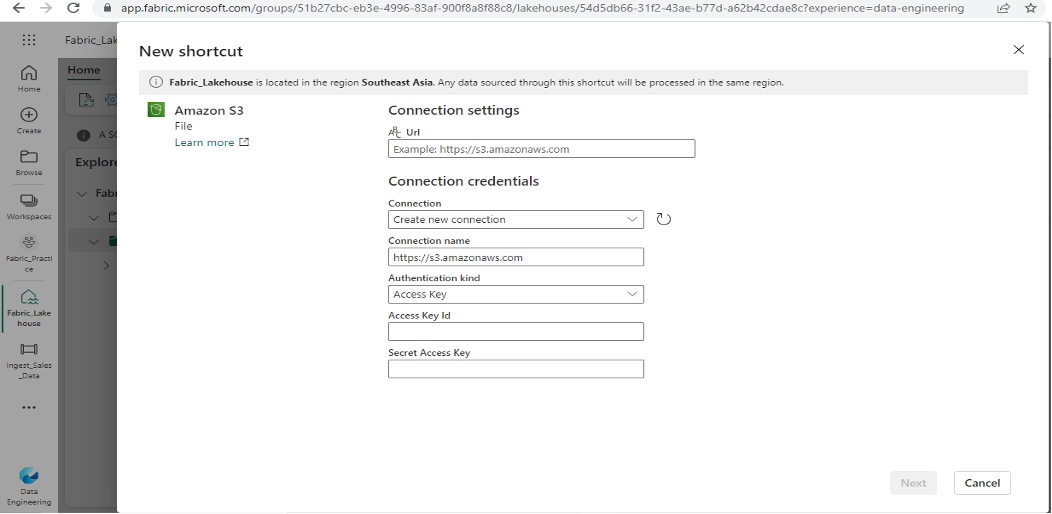
- Right-click on the Files folder and choose “New Shortcut”. In the new tab, select “Amazon S3” as the data source. Then select the same connection you created earlier.
- A new folder will be created with the given shortcut name. This folder will point to the S3 bucket and will contain both the sales.csv and customer.csv files.

Step 7: Create a Notebook
- Open your workspace in the data engineering view and select “New Notebook”.
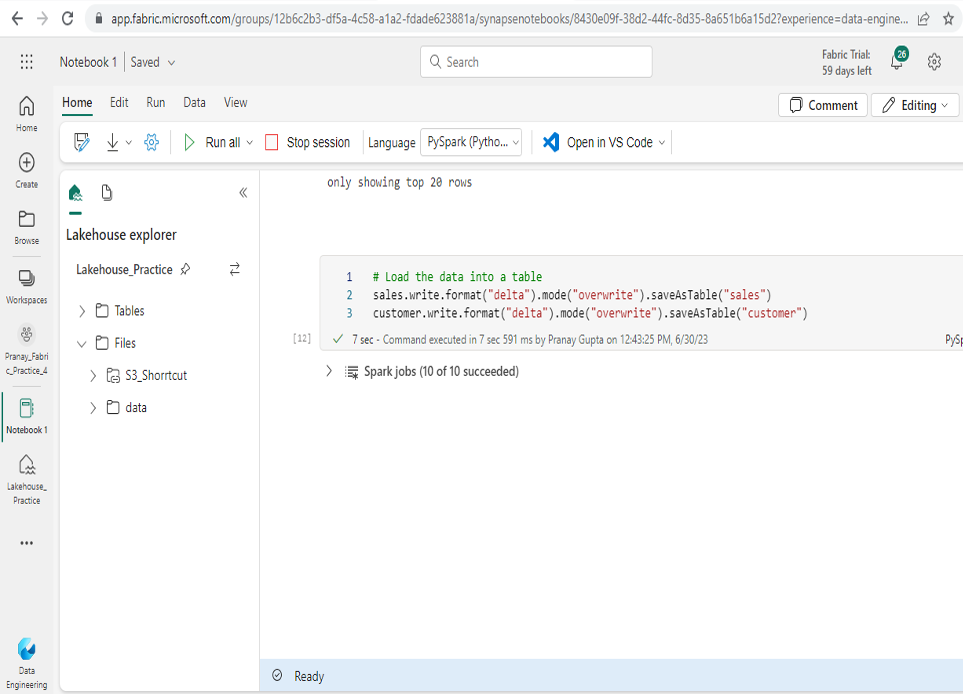
- Once the notebook is open, you can perform data transformations using Spark DataFrame operations.
- Apply the desired transformations to manipulate the data as needed.
- Finally, save the DataFrame as a table in the lakehouse, which will persist the transformed data.


Step 8: Modify the pipeline
- In the previously created pipeline, locate the notebook activity and place it on the right side of the copy data activity.
- Connect the output of the copy data activity to the input of the notebook activity. This ensures that the notebook activity will run only after the copy data activity successfully completes.
- Additionally, under the settings tab of the notebook activity, select the notebook that you created earlier for performing data transformation.

Step 9: Run the pipeline
- Once you have saved and executed the pipeline successfully, you will be able to view two tables named “sales” and “customer” under the Tables folder in your lakehouse. These tables will be created because of the data ingestion and transformations performed during the execution of your spark notebook in the pipeline.

Step 10: Create a Power BI report
- The tables within your lakehouse are automatically incorporated into a default dataset, which establishes a data model for reporting purposes with Power BI.
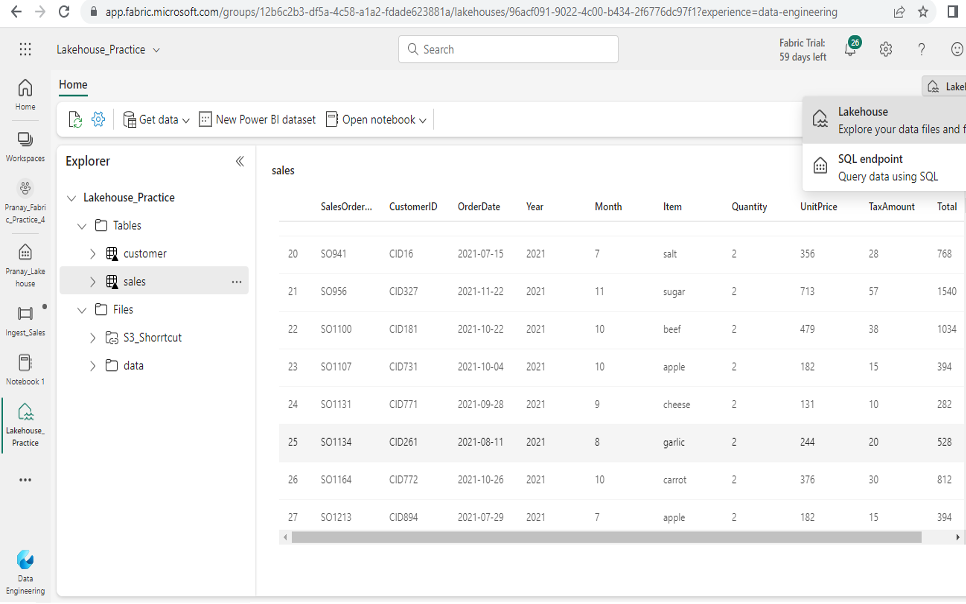
- On the Lakehouse page, locate the switch at the top-right corner and change the view from “Lakehouse” to “SQL Endpoint”.
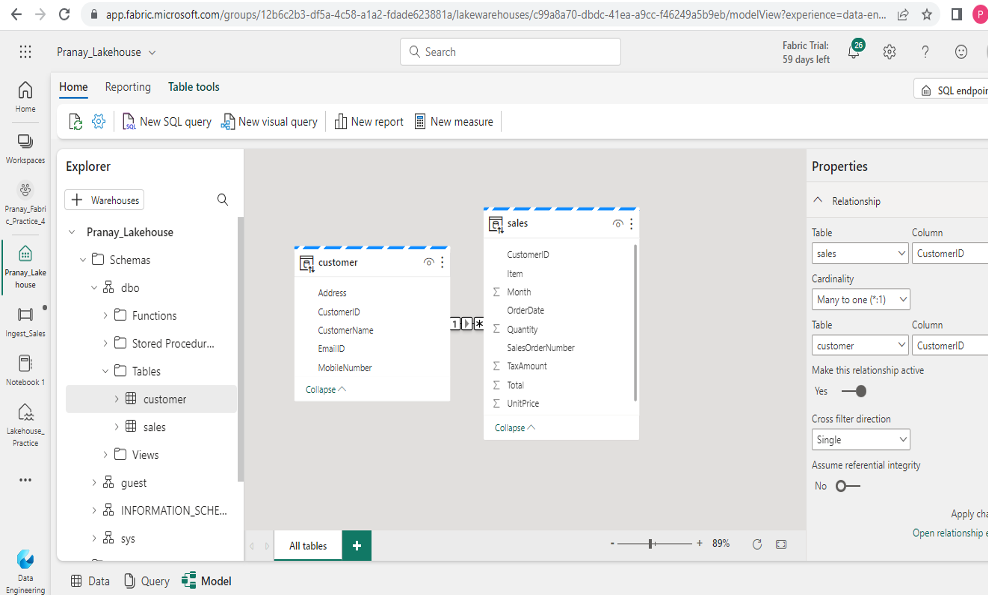
- Scroll down to the bottom of the SQL Endpoint page and select the “Model” tab. This tab will display the data model schema for the dataset.
- To establish a relationship between the tables, click and drag the “CustomerID” column from the “sales” table to the “CustomerID” column in the “customer” table since it is a common column between the tables. Choose the “many-to-one” relation option.
- Once you have configured the relationship, click “OK” to save the changes.

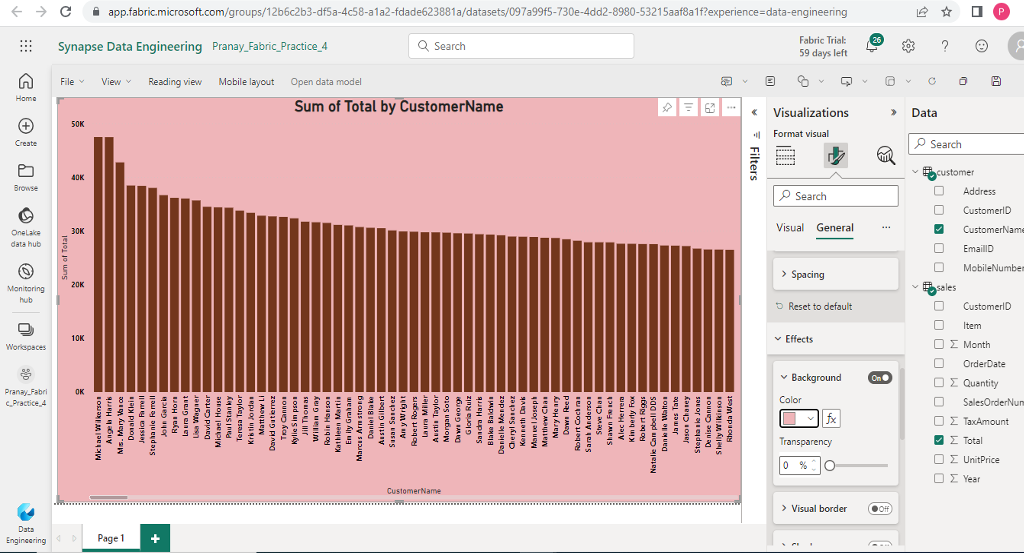
- Go to the menu ribbon and click on the “Reporting” tab. Then, select “New report”. This action opens a new browser tab where you can design your report.
- Create a bar chart in the report that displays the total sales by customer name.
- Once the chart is created, save the report by providing a name of your choice.
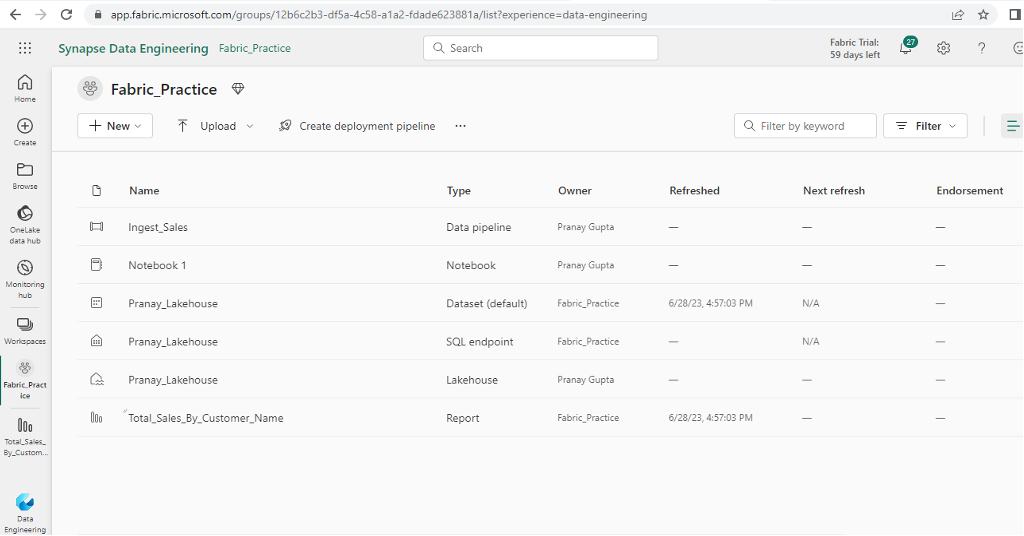
- Select your Lakehouse and you will be able to see your report has been saved there.
In this example, I’ve illustrated the seamless integration of different Microsoft services within Microsoft Fabric. I’ve demonstrated how you can build the entire analytics solution without requiring additional connections, except for Amazon S3 as the data source.
This integration highlights the unified capacity model of Microsoft Fabric. It optimizes resource management, minimizes waste, reduces costs, and ensures efficient resource utilization.
As a result, users can enjoy a smooth and integrated experience. This is while leveraging the various capabilities provided by Microsoft Fabric!
Mail us with your impressions of Fabric, or if you’d like to learn about our data analytics endeavors.