Businesses often use Power BI and rely on frequent refreshes to keep up with some daily reports or data tracking. However, the booming popularity of data st
But before you invest in push datasets for real time dashboards, you must go through these considerations:
reaming coupled with the ever-increasing customer expectations have rendered simple refreshes inadequate.
In order to keep up with evolving business needs and ensure customer satisfaction, Power BI has come up with a solution that works with real time datasets that help in rapid visualization and decision-making with the help of dashboards.
So, what really is a real time dashboard? Well, a real time dashboard is a dashboard that continuously updates in real time according to latest data entered in the database. For example, if we are analyzing the data for the number of patients that have tested positive for COVID, we need a dashboard which shows the latest count of patients. In such a case, we will need to develop a real time dashboard which changes the count according to the patient’s data entered.
Before we move on, I urge you to note that if you are working in an import mode while developing your report then you cannot get data in real time. To receive it, it is important to set a refresh policy.
Then if you want real time data the first technique that I can think of is through DirectQuery Mode. However, despite the fact that DirectQuery is real time, there are some limitations to it. It is slower and will impact performance, making it difficult to develop just then one or two real time dashboards by moving the entire solution to DirectQuery mode. This problem is tackled by Power BI which provides different datasets in real-time.
Here are some types of real-time datasets that are provided by Power BI-
- Streaming Dataset
- PubNub Streaming Dataset
- Push Dataset
Allow me to elaborate on these types and dive deep into implementing push datasets.
Streaming Dataset: With a Streaming dataset, Power BI stores the data into a temporary cache which can be used to display visuals. The way to visualize the streaming dataset is by adding tiles to visualize the data. The dataset has some transient sense of history, and the main highlight here is that the temporary cache will quickly expire. Streaming dataset is a great option when you have data that is relevant in the moment.
PubNub Streaming Dataset: PubNub streaming datasets are integrated with the PubNub data stream network. If you use PubNub streaming dataset then data will not be stored permanently in Power BI for historic analysis. In this, the data is not being pushed into Power BI.
PubNub streaming dataset can only be visualized by adding tiles to the dashboard wherein you have to configure a PubNub data stream as the source.
Push Dataset: With this type of dataset, we can push data into Power BI services. By default, it is an empty dataset where data model or Power BI does not do anything until you push the data into the dataset and all the dashboards which are linked to that dataset get refreshed to update new data.
Once a report is created using the push dataset, any of its visuals can be pinned to the dashboard. Here, visuals get updated in real-time whenever the data is updated in the actual database. So, every time the dashboard will refresh with new values.
You cannot create a push dataset on a Power BI desktop. It is necessary to use Power BI services. Push dataset handles all its interactions through a REST API and you need to leverage the same thing for pushing data into a push dataset with the help of some code.
Here are some points that you need to take into consideration before implementing a push dataset in Power BI Premium:
- If you are using Azure stream as your data source, then you require Azure Stream Analytics which uses the Power BI REST APIs to create its output data stream to Power BI.
- If you are using PubNub as your data source, then you require PubNub Access Manager (PAM) authentication key.
Now, moving on to the actual implementation. Let us see the scenario below:
I will query a local copy of the “PushDataset “[Name of my DB present in SQL server database which contains the data of ordered products) and push that data to my new dataset created on Power BI services using a PowerShell script. I will then enter some new records to see whether my dashboard is getting updated with the latest data.
First, I will need to create a push dataset on a Power BI service account. Here’s how:
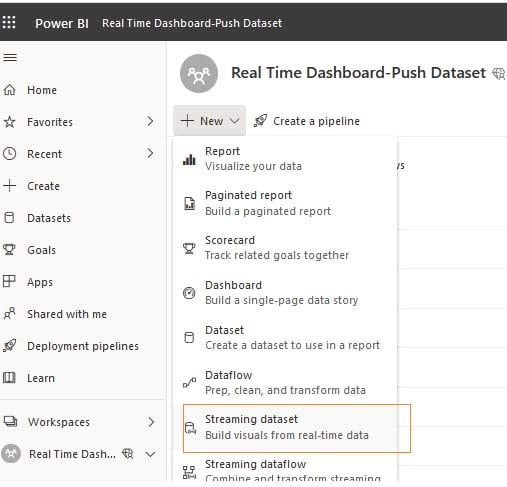
1] Go to Power BI services account and select the workspace where you want to create the push dataset.
Click on new -> Streaming Dataset
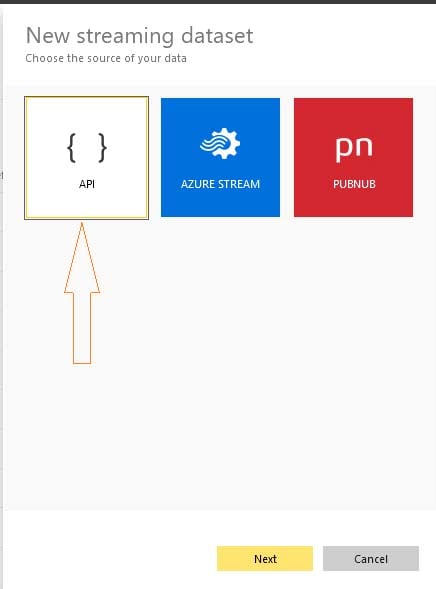
2] Choose the Source as API and then Click on Next.
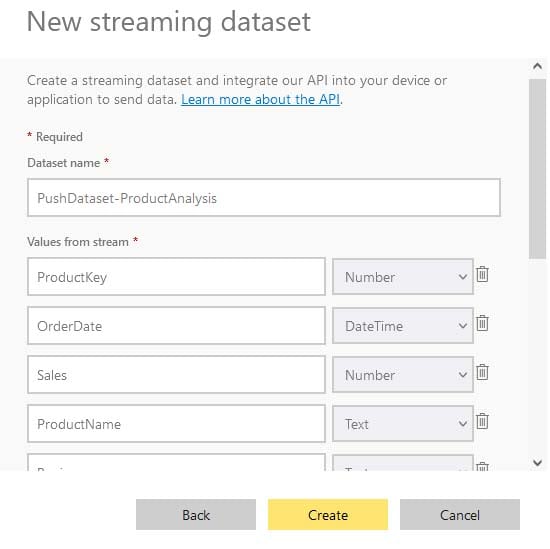
3] Here you can give a unique name to your dataset and define the fields or columns that you want to see in real time. So, I have created dataset with ProductKey, OrderDate, Sales, ProductName, Region, and Country and specified the data types (These columns are present in my SQL server database).
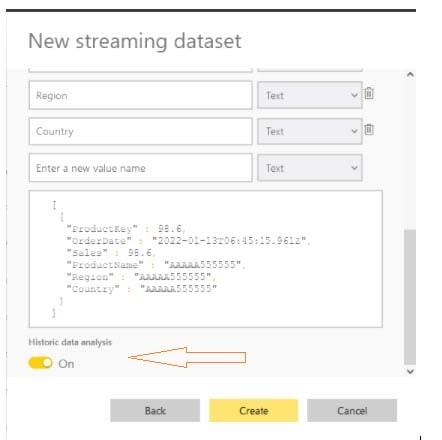
4] Scroll down and make sure you keep Historic data analysis enabled before you click on create.
[Note: If you disable Historic Data Analysis then the created dataset will be streaming dataset. When Historic data analysis is enabled, the dataset created becomes both a streaming dataset and a push dataset]
5] In this step, you can successfully create a push dataset. As shown in the image below, you will receive the Push URL of your created dataset. Note that because the push dataset will use this URL for next interactions.
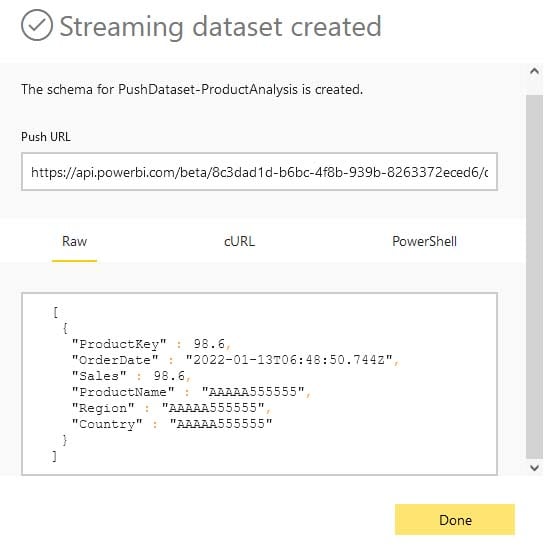
Power BI provides us with the sample scripts (Raw, cURL, PowerShell) to push data into our dataset.
You can see the PowerShell script that I am using in my demo. Feel free to copy it and keep it in your notepad for your own experiments.

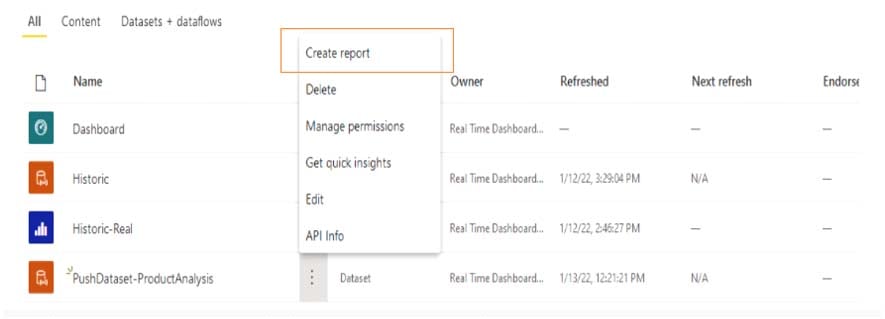
6] Click on Done, then you will be redirected to your workspace where you can see the dataset created as shown in the image.

7] Next, you have to create report from the dataset.
Right click on PushDataset-ProductAnalysis-> Create Report
[Note: You can see the option of “Create Report” as I have kept “Historic Data Analysis” enabled while creating the dataset. As mentioned earlier, if you disable it then the dataset will be a streaming dataset and you cannot find the option of creating a report. This is because with streaming dataset you can only add tiles in dashboard, you cannot produce a report on top of that.]
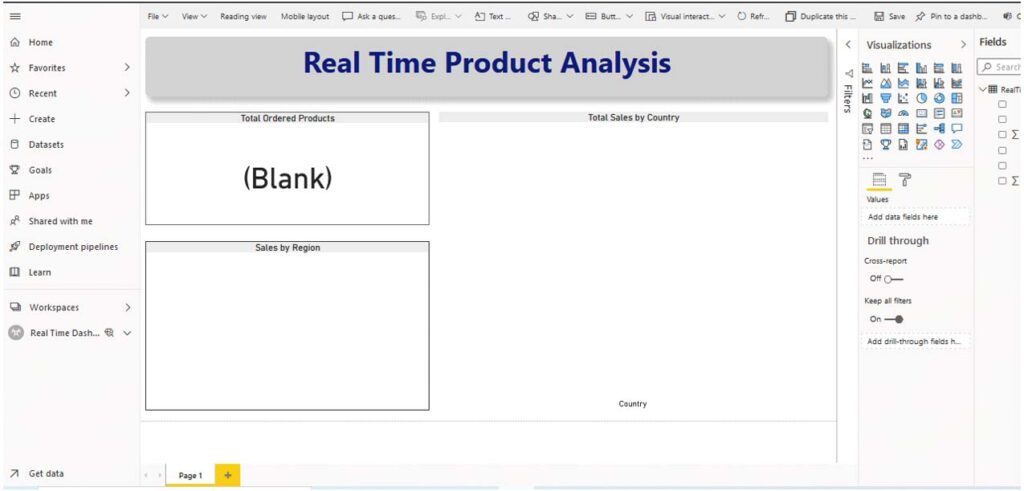
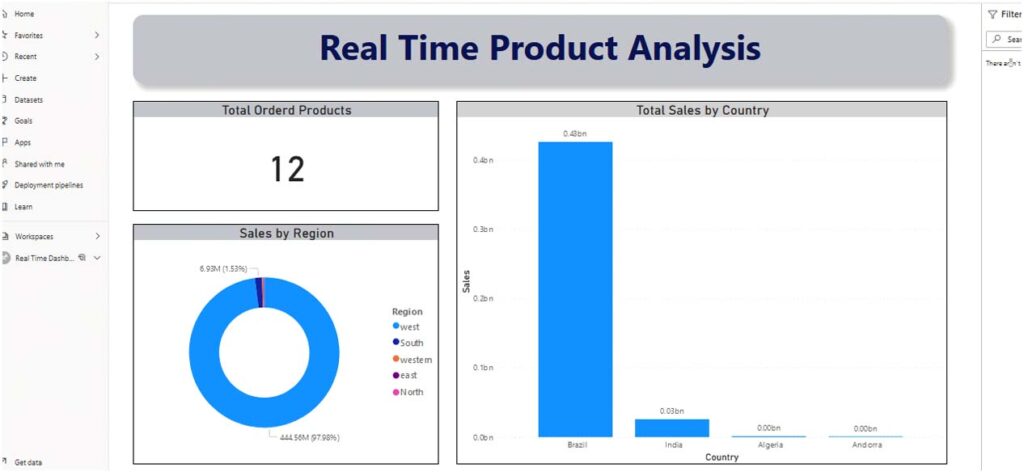
8] I have created Report which contains a card that shows you the count of products ordered, sales by region, and total sales by country.
Initially, the report will show you a blank for every visual, but don’t worry. More often than not, it is left blank because we have not pushed any data to “PushDataset-productAnalysis” dataset yet.
9] So, to push data into the dataset you need to code some script. Here, I will use the PowerShell script from the previous step. But I need to modify the script because I need to push data from my SQL server database. Here I need to write some queries to fetch the required data and make sure to create a connection to SQL Server to access the data from that location.
I have used Windows PowerShell ISE to run the script.
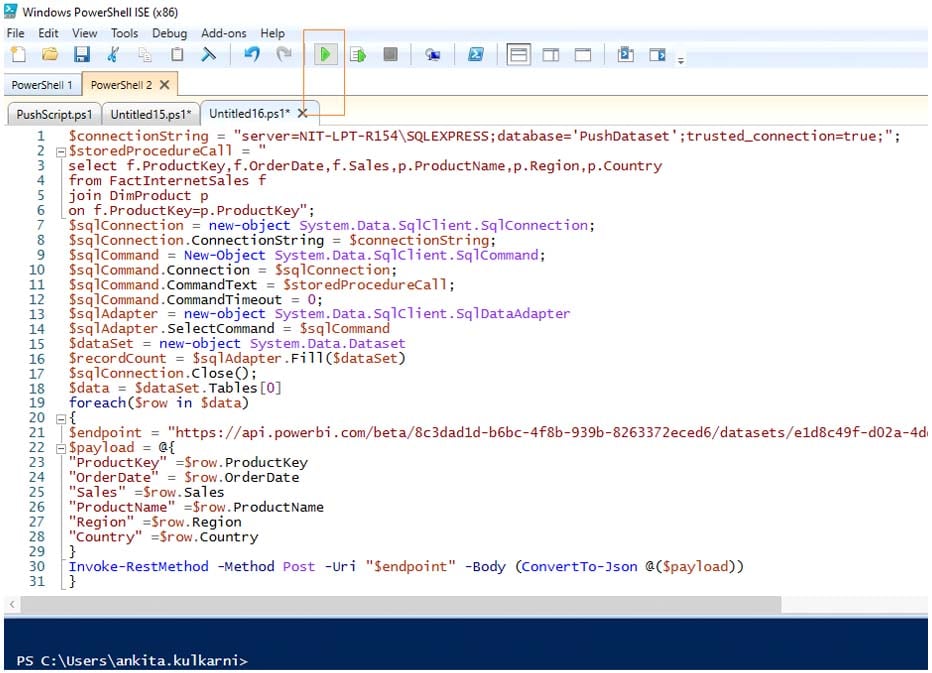
Above image shows the modified script according to My SQL server and dataset columns I have created.
Click on Run.
10] As soon as you run the script you can see your refreshed report.
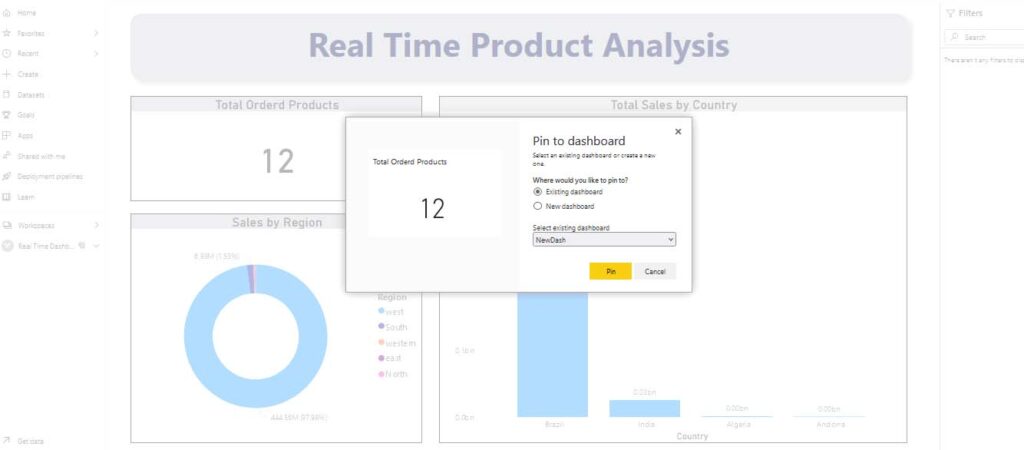
11] Now we need to pin our visuals to the dashboards from the report to see the real time updates. However, you can pin the visual to a dashboard and see it refresh automatically. Click on pin of any visual that you want to see on the real time dashboard. Either you can create a new dashboard, or you can pin the visual to the existing dashboard.
Once a visual is pinned to a dashboard, you can use “Q&A” to ask questions of the push dataset in natural language and you can pin the resulting visual back to the dashboard, and that dashboard will also update in real-time.
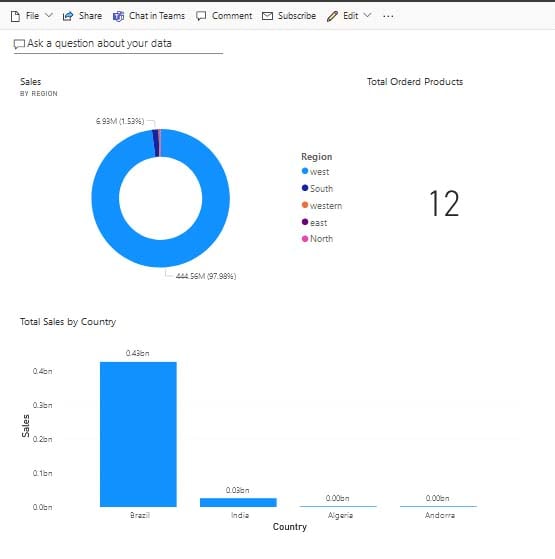
I have pinned all three visuals from my report to the dashboard.
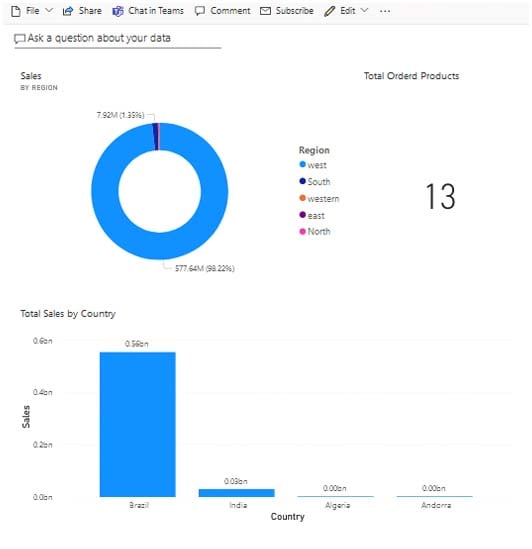
12] This is how my dashboard looks now. You also can ask any question on your dashboard just like the Q&A on screen.
13] Now we will check after entering the new records to see whether our solution is working.
For the sake of understanding I have kept only a few records in SQL server database so you can observe the changes clearly.
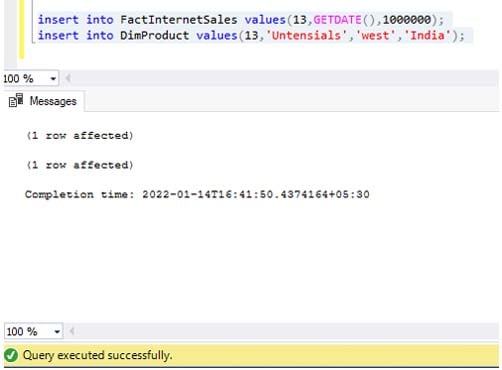
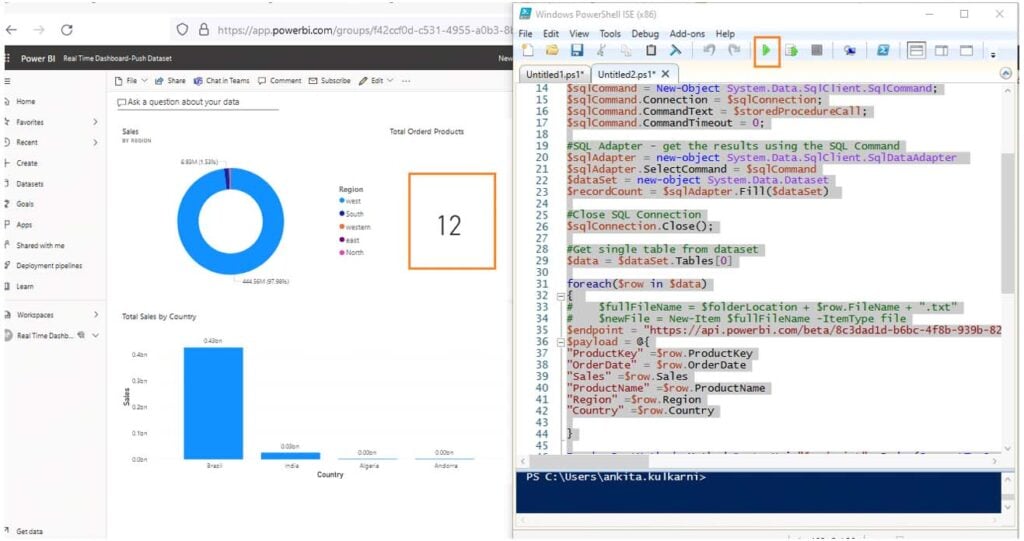
Keep in mind that first our card shows the ordered product count as 12. And keep an eye on all visuals to see how they change. Here I have entered a new record in the SQL server. After entering one record it should be 13 and all visuals need to change according to the latest data.
14] Now I will show you parallelly how the real time visuals are changing.
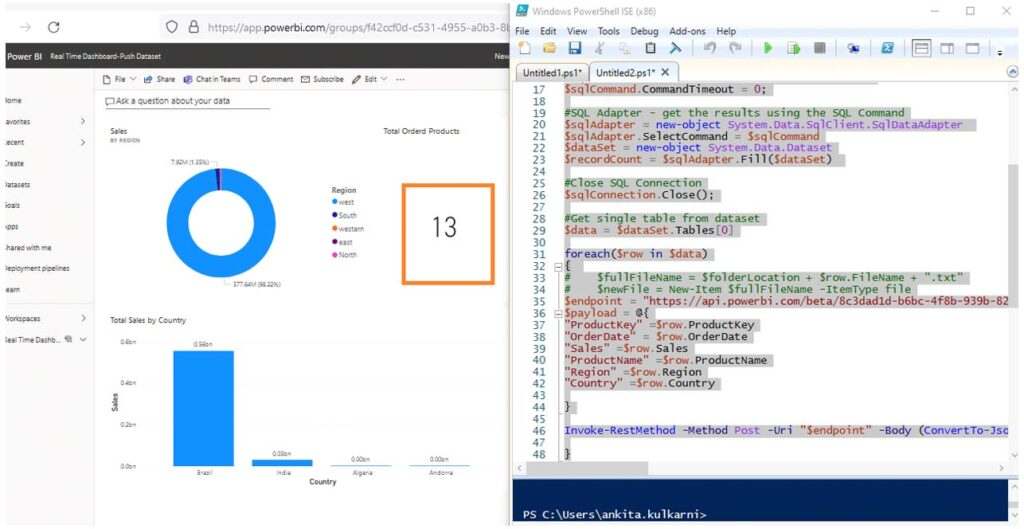
You can see the dashboard and the script here. This is the script that I had used in the previous step. Now click on RUN as shown in the image from PowerShell window.
15] As soon as you click on the Run Option on PowerShell the new record that is entered in the SQL server is updated through REST API and the dashboard will update with the real time data to show the count as 13.
Now you are ready to interact with your Dashboard.
So, you can see how PowerShell script can be run manually or can be scheduled to run using Windows Task Scheduler or any other scheduling tool that you use in your environment. Since the script makes use of the Power BI REST API, you can add up to 1,000,000 rows per hour, per dataset. Marvelous, isn’t it?!
But before you invest in push datasets for real time dashboards, you must go through these considerations:
– A maximum of 75 columns per table can be inserted.
– A maximum of 75 tables per push dataset can be inserted.
– A maximum of 10,000 rows per single POST rows call can be inserted and a maximum of 1,000,000 rows added per hour per dataset.
– A maximum 5 pending POST rows requests per dataset can be permitted and maximum rows per table will depend on retention policy:
1. No retention policy: max 5,000,000 rows per table
2. FIFO retention policy: max 200,000 rows per table
– A maximum rate of data ingestion is 1 request/s 16 MB/request
– The limit on data throughput is 1M rows/Hour
To sum up, allow me to leave you with some benefits of real time dashboards run by Power BI.
- Data is stored permanently in Power BI for historic analysis.
- Power BI report can be built on top of a push dataset.
- Real time updates can be availed.
- Performance will be impacted positively.
Reach out to us at Nitor Infotech to learn more about our data engineering services.